Shorthand to generate branded ggplots. Uses theme_brand() to control colors and fonts, and has Y-axis on the right. Axis placement can be quickly modified with argument axes.
Arguments
- data
Default dataset to use for plot. If not already a data.frame, will be converted to one by
fortify(). If not specified, must be supplied in each layer added to the plot.- mapping
Default list of aesthetic mappings to use for plot. If not specified, must be supplied in each layer added to the plot.
- axes
position of X (
bottomortop) and Y (leftorright) primary axes (default:bottomright)- ...
Arguments passed on to
theme_brandbase_colorBootstrap color name for text and line elements, or color code
base_bgBootstrap color name for plot, panel background, or color code
base_familyone of
_brand.ymlfont families (currently onlybase,monospace, orheadings), else a valid system or Google font family namegridshow gridlines
XY,X,Y(default) ornfor no gridlinelegendshorthand for
theme(legend.position="...")(default:top)gradientnames of Bootstrap colors for continuous gradient (default:
c("blue", "orange", "red"))base_sizebase font size, given in pts.
Examples
require(ggplot2)
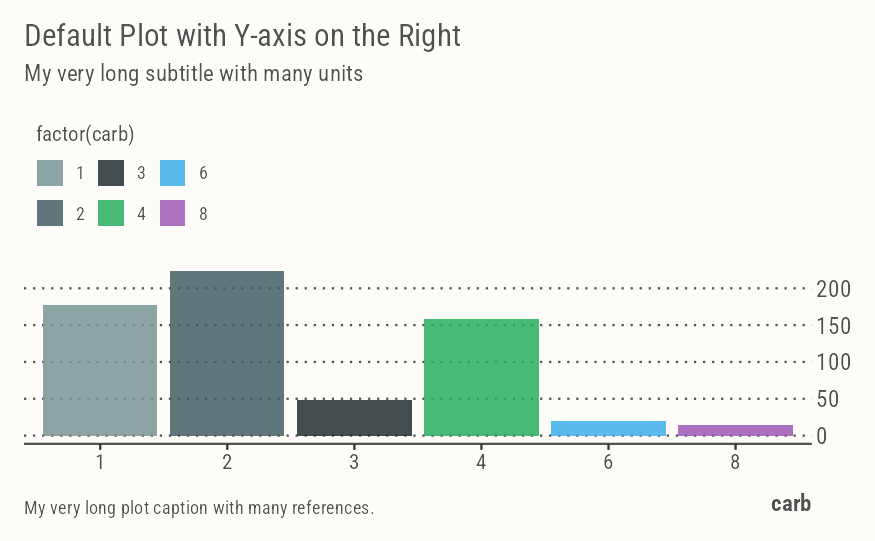
ggbrand(mtcars, aes(factor(carb), mpg, fill=factor(carb))) +
geom_col() +
labs(
x = "carb",
title = "Default Plot with Y-axis on the Right",
subtitle = "My very long subtitle with many units",
caption = "My very long plot caption with many references.")
 # Equivalent to below
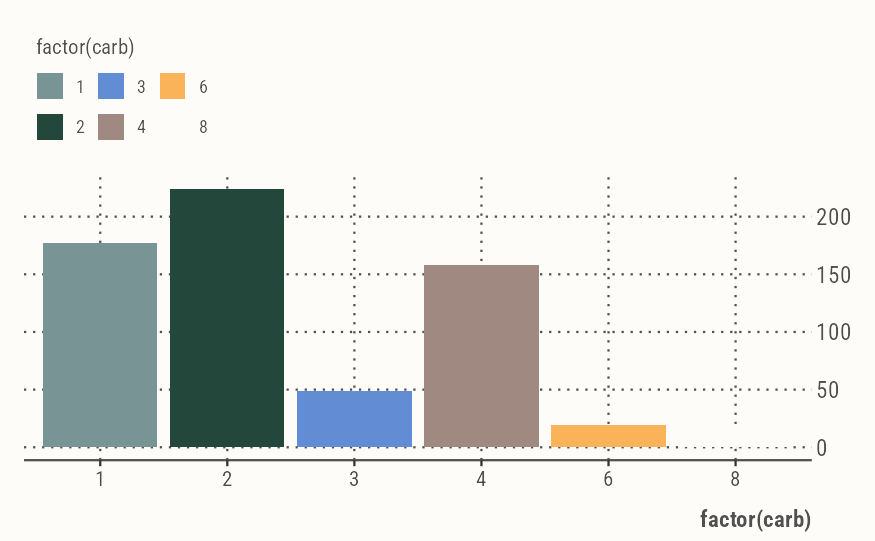
ggplot(mtcars, aes(factor(carb), mpg, fill=factor(carb))) +
geom_col() +
scale_brand_df() +
guides(y=guide_axis(position="right")) +
theme_brand(grid="XY")
# Equivalent to below
ggplot(mtcars, aes(factor(carb), mpg, fill=factor(carb))) +
geom_col() +
scale_brand_df() +
guides(y=guide_axis(position="right")) +
theme_brand(grid="XY")
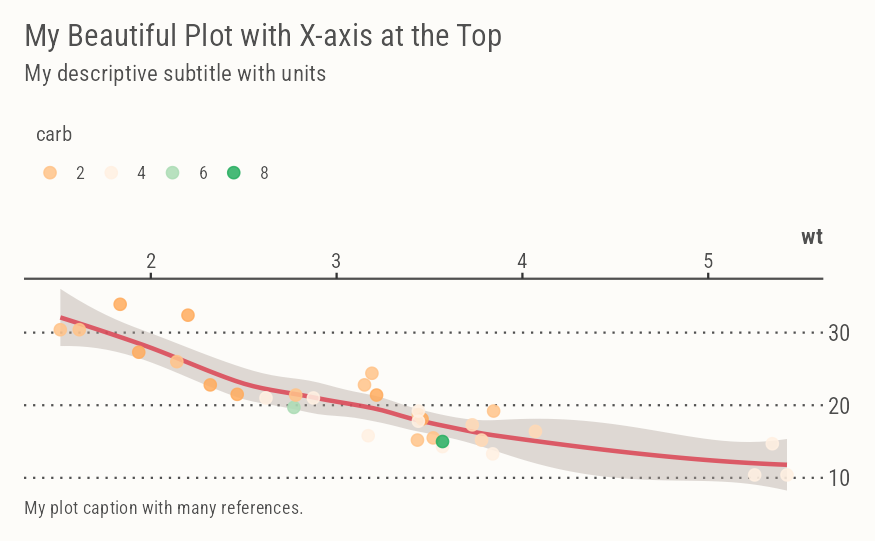
 ggbrand(mtcars, aes(wt, mpg, color=carb), axes="topright") +
geom_smooth(color=pal("red"), fill=pal("pink")) +
geom_point(size=3) +
guides(color=guide_legend(nrow=1)) +
labs(
title = "My Beautiful Plot with X-axis at the Top",
subtitle = "My descriptive subtitle with units",
caption = "My plot caption with many references.")
#> `geom_smooth()` using method = 'loess' and formula = 'y ~ x'
ggbrand(mtcars, aes(wt, mpg, color=carb), axes="topright") +
geom_smooth(color=pal("red"), fill=pal("pink")) +
geom_point(size=3) +
guides(color=guide_legend(nrow=1)) +
labs(
title = "My Beautiful Plot with X-axis at the Top",
subtitle = "My descriptive subtitle with units",
caption = "My plot caption with many references.")
#> `geom_smooth()` using method = 'loess' and formula = 'y ~ x'
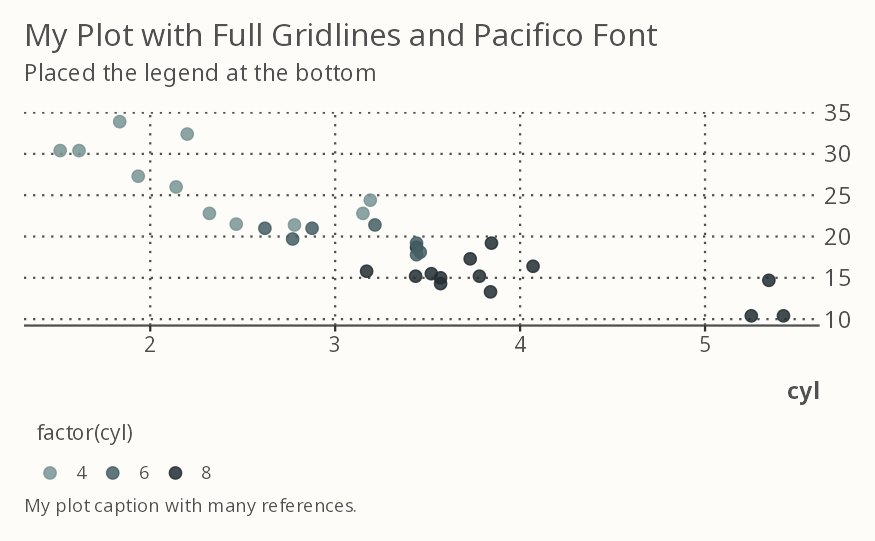
 ggbrand(mtcars, aes(wt, mpg, color=factor(cyl)),
grid="XY", legend="bottom", base_family="Pacifico") +
geom_point(size=3) +
labs(
x = "cyl",
title = "My Plot with Full Gridlines and Pacifico Font",
subtitle = "Placed the legend at the bottom",
caption = "My plot caption with many references.")
ggbrand(mtcars, aes(wt, mpg, color=factor(cyl)),
grid="XY", legend="bottom", base_family="Pacifico") +
geom_point(size=3) +
labs(
x = "cyl",
title = "My Plot with Full Gridlines and Pacifico Font",
subtitle = "Placed the legend at the bottom",
caption = "My plot caption with many references.")