Agricultural Transformation in Ghana, Ethiopia, and Tanzania
BACOU, Melanie for BMGF
Last updated on 2017-12-06 – CODES AND NOTES, DO NOT USE OR CITE
1 Data Preparation
1.1 Harmonized Codebook
This study combines household-level micro data for 4 countries across multiple survey years. To expedite data reconciliation steps we choose to rely as much as possible on FAO RIGA-H cross-country harmonized household-level database. RIGA expenditure and income aggregates are used to estimate both farm and crop sales and farm vs. non-farm income. We also include additional household-level variables available through IFPRI replication datasets. Below is a full codebook.
Sampling
| Variable | Label | Unit | Source |
|---|---|---|---|
| hhid | unique hhld identifier | character | raw data |
| clust | unique cluster identifier | integer | raw data |
| svyCode | survey code | gha-glss4, gha-glss5, gha-glss6, tza-nps-2008, tza-nps-2010, tza-nps-2012, tza-nps-14, eth-ess-2015, eth-ess-2013, eth-erss-2011 | calculated |
| wave | survey round | wave 1, wave 2, etc. | calculated |
| survey | survey short label (for printing) | character | calculated |
| year | survey year | integer | raw data |
| month | survey month | integer | raw data |
| strata | unique strata identifier (see doco for details) | varies by country | calculated |
| weight | population weight (by wave) | decimal | raw data |
| phhid | unique hhld identifer for panel analysis | integer | raw data |
| pweight | panel weight | decimal | raw data |
| pcount | number of revisits (for panel analysis) | integer | calculated |
| nh | hhld identifier (used in raw data) | integer | raw data |
| rural | locality (rural/urban) | rural, urban | raw data |
| res | locality (other) | character | raw data |
Geography
| Variable | Label | Unit | Source |
|---|---|---|---|
| svyL1Cd | level-1 admin unit code (linked to survey map) | integer | calculated |
| svyL1Nm | level-1 admin unit label (linked to survey map) | character | calculated |
| svyL2Cd | level-2 admin unit code (linked to survey map) | integer | calculated |
| svyL2Nm | level-2 admin unit label (linked to survey map) | label | calculated |
| svyL3Cd | level-3 admin unit code (linked to survey map) | integer | calculated |
| svyL3Nm | level-3 admin unit label (linked to survey map) | label | calculated |
| X | hhld GPS longitude | decimal | raw data |
| Y | hhld GPS latitude | decimal | raw data |
| lon_dd_mod | anonymized longitude | decimal | raw data |
| lat_dd_mod | anonymized latitude | decimal | raw data |
| region | region label used in raw data | character | raw data |
| region_cd | region code used in raw data | integer | raw data |
| district | district/woreda label used in raw data | character | raw data |
| district_cd | district/woreda code used in raw data | integer | raw data |
| ward | ward/kebele label used in raw data | character | raw data |
| ward_cd | ward/kebele code used in raw data | integer | raw data |
| zone | other zoning label | character | raw data |
| zone_cd | other zoning code | integer | raw data |
| ez | agroecological zone | character | RIGA |
| lc_esa | ESA land cover classification, dominant | code | calculated |
| suit_gaez | FAO/GAEZ suitability, 9-class | 0-no data, 1-very high (> 85%), 2-high (> 70%), 3-good (> 55%), 4-medium (> 40%), 5-moderate (> 25%), 6-marginal (> 10%), 7-very marginal (> 0%), 8-not suitable (0%), 9-water | calculated |
| suit_glues | GLUES suitability (point, mean, or median) | decimal | calculated |
| cell5m | HarvestChoice 5-arc-minute grid CELL5M ID | integer | calculated |
Demographics
| Variable | Label | Unit | Source |
|---|---|---|---|
| hhsize | hh size | person | RIGA |
| msize | number of males in the hh | person | RIGA |
| fsize | number of females in the hh | person | RIGA |
| femhead | female headed hh | 0,1 | RIGA |
| snghead | single head of hh | 0,1 | RIGA |
| widowhead | female head of hh widow | 0,1 | RIGA |
| marriedhead | head of hh married | 0,1 | RIGA |
| agehead | age head of hh | years | RIGA |
| educhead | years of education head of hh | years | RIGA |
| educhigh | highest years of education in hh | years | RIGA |
| educadult | ave years of education among hh members, >15 yrs | years | RIGA |
| educave15_60 | ave years of education among hh members, 15-60 yrs | years | RIGA |
| educave | ave years of education in hh | years | RIGA |
| hhlabor | hh labor age >14 but <60 yrs | person | RIGA |
| mlabor | hh male labor age >14 but <60 yrs | person | RIGA |
| mlaborshare | hh share of male labor | share, 0-1 | RIGA |
| flabor | hh female labor age >14 but <60 yrs | person | RIGA |
| flaborshare | hh share of female labor | share, 0-1 | RIGA |
Assets
| Variable | Label | Unit | Source |
|---|---|---|---|
| brickwalls | dwelling has brick walls | 0,1 | RIGA |
| cellphone | household has mobile phone | 0,1 | RIGA |
| cementfloor | dwelling has cement floors | 0,1 | RIGA |
| electricity | household has electricity | 0,1 | RIGA |
| hhmignet | household migration network | 0,1 | RIGA |
| nondirtfloor | dwelling has non-dirt floors | 0,1 | RIGA |
| ownhome | household owns dwelling | 0,1 | RIGA |
| runwater | household has internal running water | 0,1 | RIGA |
| safewater | household has safe drinking water | 0,1 | RIGA |
| telephone | household has fixed telephone line | 0,1 | RIGA |
| toilet | household has toilet | 0,1 | RIGA |
| landless | hh is landless | 0,1 | RIGA |
| landown | land owned | ha | RIGA |
| landrent | land rented out by hh | ha | RIGA |
| ilandown | hectares of irrigated land owned | ha | RIGA |
| rlandown | hectares of rain-fed land owned | ha | RIGA |
| landshare | land sharecropped out by hh | ha | RIGA |
| landquint | land ownership quintiles | qtl, 1-5 | RIGA |
| TLU_cattle | tropical livestock units: cattle | TLU | RIGA |
| TLU_horse | tropical livestock units: horses | TLU | RIGA |
| TLU_pigs | tropical livestock units: pigs | TLU | RIGA |
| TLU_sheep | tropical livestock units: sheep, goats | TLU | RIGA |
| TLU_small | tropical livestock units: chicken, rabbits, other poultry | TLU | RIGA |
| TLU_total | tropical livestock units: total | TLU | RIGA |
| TLU_draft | Tropical Livestock Units: draft | TLU | RIGA |
| wealth | RURAL: wealth index | index | RIGA |
| agwealth | agricultural wealth index | index | RIGA |
Income
| Variable | Label | Unit | Source |
|---|---|---|---|
| agmisc | value total annual agricultural production - misc. uses | lcu | RIGA |
| agowncons | value total annual agricultural production consumed | lcu | RIGA |
| agr_wge | wage employment - agr, fishing | lcu | RIGA |
| farmrntimp | annual income received from rental of farm real estate assets, imputed | lcu | RIGA |
| nonagr_wge | wage employment - non-farm activities | lcu | RIGA |
| nonfarmrntimp | annual income received from non-farm real estate assets, imputed | lcu | RIGA |
| otherincimp | other non-labor income, imputed | lcu | RIGA |
| selfemp | annual net non-farm self employment income, imputed | lcu | RIGA |
| selfimp1 | net HH income from ag business - agr, fishing, imputed | lcu | RIGA |
| shagmisc | share of annual agricultural production misc in total agricultural production | share, 0-1 | RIGA |
| shagowncons | share of annual agricultural production consumed in total agricultural productio | share, 0-1 | RIGA |
| shagprodsold | share of annual agricultural production sold in total agricultural production | share, 0-1 | RIGA |
| shcropsold | share of total annual crop production sold in total crop production | share, 0-1 | RIGA |
| shlvstsold | share of total annual livestock production sold in total livestock production | share, 0-1 | RIGA |
| totagprod | value total annual agricultural production | lcu | RIGA |
| totagsold | value total annual agricultural production sold | lcu | RIGA |
| totcropprod | value of total annual crop production | lcu | RIGA |
| totcropsold | value total annual crop production sold | lcu | RIGA |
| totlivsold | value total annual livestock production sold | lcu | RIGA |
| totlvstprod | value of total annual livestock production | lcu | RIGA |
| share_agtot | share of income from crop, livestock and agricultural wages (net) | share, 0-1 | RIGA |
| share_nonagtot | share of income from non-ag wage, selfemp, transfers, other (net) | share, 0-1 | RIGA |
| share_offarm | share of income from ag-wage, non-ag wage, selfemp, transfers, other (net) | share, 0-1 | RIGA |
| share_nonfarm | share of income from non-ag wage and selfemp (net) | share, 0-1 | RIGA |
| sh2crop2 | share of crop production in totincome1 | share, 0-1 | RIGA |
| cropincome1grossimp | gross crop income (crop1) | lcu | RIGA |
| cropincome2grossimp | gross crop income (crop2) | lcu | RIGA |
| livestockgrossimp | gross livestock income, imputed | lcu | RIGA |
| transfersgrossimp | annual total incoming public and private transfers, imputed | lcu | RIGA |
| pcexp | pc expenditures, hhexp2/hhsize | lcu | RIGA |
| quintile | rural pcexp quintiles | qtl, 1-5 | RIGA |
| share_onfarm | share of income from crop, livestock activities (net) | share, 0-1 | RIGA |
| quinturb | urban pcexp quintiles | qtl, 1-5 | RIGA |
| quinttot | rural & urban pcexp quintiles | qtl, 1-5 | RIGA |
| decile | rural pcexp deciles | dec, 1-10 | RIGA |
| decilurb | urban pcexp deciles | dec, 1-10 | RIGA |
| aggross | value of total annual farm income | lcu | calculated |
| naggross | value of total annual non-farm income | lcu | calculated |
| naggross_sh | share of non-farm income in total income | share, 0-1 | calculated |
| cropsales | value of annual crop sales | lcu | calculated |
| totgross | value of total annual gross income | lcu | calculated |
| cropsales_sh | share of annual crop production sold | share, 0-1 | calculated |
| cropvalue | value of annual crop production | lcu | calculated |
| agsales | value of annual farm sales | lcu | calculated |
| agsales_sh | share of annual farm production sold | share, 0-1 | calculated |
Infrastructure
| Variable | Label | Unit | Source |
|---|---|---|---|
| infraindex | RURAL: index of access to infrastructure | index | RIGA |
| infraindex_natl | NATIONAL: index of access to infrastructure | index | RIGA |
| infraindex_urb | URBAN: index of access to infrastructure | index | RIGA |
| distbank | km from community to bank | km | RIGA |
| disthealth | km from community to health facility | km | RIGA |
| distprschool | km from community to nearest primary school | km | RIGA |
| distjsschool | km from community to nearest junior secondary school | km | RIGA |
| disthsrschool | km from community to nearest senior secondary school | km | RIGA |
| distsecschool | km from community to nearest government secondary school | km | RIGA |
| distprivprschool | km from community to nearest private primary school | km | RIGA |
| distprivsecschool | km from community to nearest private secondary school | km | RIGA |
| distpost | km from community to post office | km | RIGA |
| distpubphone | km from community to public phone | km | RIGA |
| distpubtrans | km from community to public transport | km | RIGA |
| distroad | km from community to nearest motorable road | km | RIGA |
| distwater | km from household to nearest water source | km | RIGA |
| disthosptl | km from community to nearest hospital | km | RIGA |
| distpolice | km from community to nearest police station | km | RIGA |
| distmarket | km from community to nearest market | km | RIGA |
Market Access
| Variable | Label | Unit | Source |
|---|---|---|---|
| tt20k_mean | IFPRI travel time to nearest market, 20K (point or area mean) | hrs | IFPRI |
| tt50k_mean | IFPRI travel time to nearest market, 50K (point or area mean) | hrs | IFPRI |
| tt100k_mean | IFPRI travel time to nearest market, 100K (point or area mean) | hrs | IFPRI |
| tt250k_mean | IFPRI travel time to nearest market, 250K (point or area mean) | hrs | IFPRI |
| tt500k_mean | IFPRI travel time to nearest market, 500K (point or area mean) | hrs | IFPRI |
| tt20k_med | IFPRI travel time to nearest market, 20K (median over area) | hrs | IFPRI |
| tt50k_med | IFPRI travel time to nearest market, 50K (median over area) | hrs | IFPRI |
| tt100k_med | IFPRI travel time to nearest market, 100K (median over area) | hrs | IFPRI |
| tt250k_med | IFPRI travel time to nearest market, 250K (median over area) | hrs | IFPRI |
| tt500k_med | IFPRI travel time to nearest market, 500K (median over area) | hrs | IFPRI |
Farm Management
| Variable | Label | Unit | Source |
|---|---|---|---|
| fert_org | farm uses organic fertilizer | 0,1 | calculated |
| fert_inorg | farm uses inorganic fertilizer | 0,1 | calculated |
| fert_any | farm uses any fertilizer | 0,1 | calculated |
| pest | farm uses pesticides | 0,1 | calculated |
| herb | farm uses herbicides | 0,1 | calculated |
| irr | farm uses irrigation | 0,1 | calculated |
| seeds | farm purchases seeds | 0,1 | calculated |
| fuel | farm purchases fuel | 0,1 | calculated |
| hired_labor | farm hires labor | 0,1 | calculated |
Farm Segmentation
| Variable | Label | Unit | Source |
|---|---|---|---|
| farm | is farm household (owns land or generates revenues from ag activities) | 0,1 | calculated |
| croparea | cultivated area (used in farm typology), imputed | ha | calculated |
| croparea_4ha | cultivated area, 2-class | <= 4 ha, > 4 ha | calculated |
| croparea_3clas | cultivated area, 3-class | <= 2 ha, 2-4 ha, > 4 ha | calculated |
| seg_mkt20k | IFPRI lo/hi market access class, 20K | mkt-lo, mkt-hi | calculated |
| seg_mkt50k | IFPRI lo/hi market access class, 50K | mkt-lo, mkt-hi | calculated |
| seg_mkt100k | IFPRI lo/hi market access class, 100K | mkt-lo, mkt-hi | calculated |
| seg_mkt250k | IFPRI lo/hi market access class, 250K | mkt-lo, mkt-hi | calculated |
| seg_mkt500k | IFPRI lo/hi market access class, 500K | mkt-lo, mkt-hi | calculated |
| seg_quad | agricultural potential segment (GAEZ) | agpot-lo / mkt-lo, agpot-lo / mkt-hi, agpot-hi / mkt-lo, agpot-hi / mkt-hi | calculated |
| seg_suit_glues | suitability class (GLUES), 2-class | agpot-lo, agpot-hi | calculated |
| seg_suit_gaez | FAO/GAEZ -derived suitability, 3-class | agpot-hi, agpot-lo, agpot-no | calculated |
| naggross_2clas | share of non-farm income in total income, 2-class | LoD, HiD | calculated |
| naggross_3clas | share of non-farm income in total income, 3-class | LoD, MeD, HiD | calculated |
| cropsales_3clas | share of crop production sold, 3-class | LoC, MeC, HiC | calculated |
| agsales_3clas | share of agricultural production sold, 3-class | LoC, MeC, HiC | calculated |
| class5 | farm typology, 5-class | subs., trans., pre-comm., specd. comm., divf. comm. | calculated |
| class6 | farm typology, 6-class | LoCLoD, LoCHiD, MeCLoD, MeCHiD, HiCLoD, HiCHiD | calculated |
| class9 | farm typology, 9-class | LoCLoD, LoCMeD, LoCHiD, MeCLoD, MeCMeD, MeCHiD, HiCLoD, HiCMeD, HiCHiD | calculated |
| fhh | FLM Typology: Farm specializer | 0,1 | RIGA |
| fmhh | FLM Typology: Farm specializer, market-oriented producer | 0,1 | RIGA |
| fshh | FLM Typology: Farm specializer, subsistence producer | 0,1 | RIGA |
| lhh | FLM Typology: Labour (wages) specializer | 0,1 | RIGA |
| mhh | FLM Typology: Migration (transfers)specializer | 0,1 | RIGA |
| divhh | FLM Typology: Diversified | 0,1 | RIGA |
1.2 RIGA Income Aggregates
Notes on RIGA variable construction (see Carletto, Covarrubias, Davis, Krausova, & Winters (2007) for a complete documentation):
- All aggregates are estimated at the household level.
- All income and expenditures are annualized.
- All income components are net of costs.
- Purchases and sales of durable goods, investments and windfall gains are excluded from household income and expenditure calculations since these are not transactions undertaken regularly by households and can result in the significant over- or under-stating of permanent income.
- All aggregates are reported in local currency (LCU).
- For each survey, only the rural sample is used (this does not seem consistent across all surveys)
- An outlier check is imposed after the construction of all income aggregates to deal with extreme income shares that arise following the aggregation of all income components. After estimating the shares of the seven principal income categories (agricultural wages, non-agricultural wages, crop, livestock, self employment, transfer and other) observations with shares greater than or less than 3 (indicating a percentage share of +/- 300%) are dropped from the aggregate.
However because RIGA income aggregates are net of costs, we construct intermediary components:
- \(cropsales\) is derived/imputed from RIGA \(totcropsold\)
- \(cropvalue\) is derived/imputed from RIGA \(totcropprod\)
- \(cropsales\_sh\) (but can also be derived from RIGA \(totcropsold\), \(shcropsold\), or \(shagprodsold\)) \[ cropsales\_sh = \frac{cropsales}{cropvalue} \]
- \(agsales\) is derived/imputed from RIGA \(totagsold\)
- \(agsales\_sh\) \[ agsales\_sh = \frac{agsales}{totagprod} \]
- \(aggross = totagprod + farmrntimp + agr\_wge (+ selfimp1)\)
- \(naggross = transfersgrossimp + otherincimp + nonfarmrntimp + nonagr\_wge + selfemp\)
- \(totgross = aggross + naggross\)
- \(aggross\_sh\)
\[ aggross\_sh = \frac{aggross}{totgross} \]
RIGA-H does not provide annual cultivated area, instead we have measures of land owned, land rented out, and land under sharecropping.
1.3 Survey Maps
In addition to reconciling household-level micro data, we also construct (approximate) district-level administrative maps for all survey waves. Survey maps and household variables may be linked using attributes svyCode, svyL1Cd, and svyL2Cd (the combination of these 3 attributes always identifies a unique district). The current maps are:
| Survey | Regions | Districts |
|---|---|---|
| tza-nps-2012 | 8 | 26 |
| eth-ess-2013 | 11 | 79 |
| eth-erss-2011 | 11 | 710 |
| gha-glss6 | 10 | 170 |
| gha-glss5 | 10 | 110 |
1.4 Agricultural Potential Quadrants
In the delineation of farm segments we construct areas of high and low agricultural potential. These areas are obtained by combining areas of high/low agricultural suitability (FAO/GAEZ 2007) with high/low market access (IFPRI 2016). These input maps and the resulting quadrants are shown here.
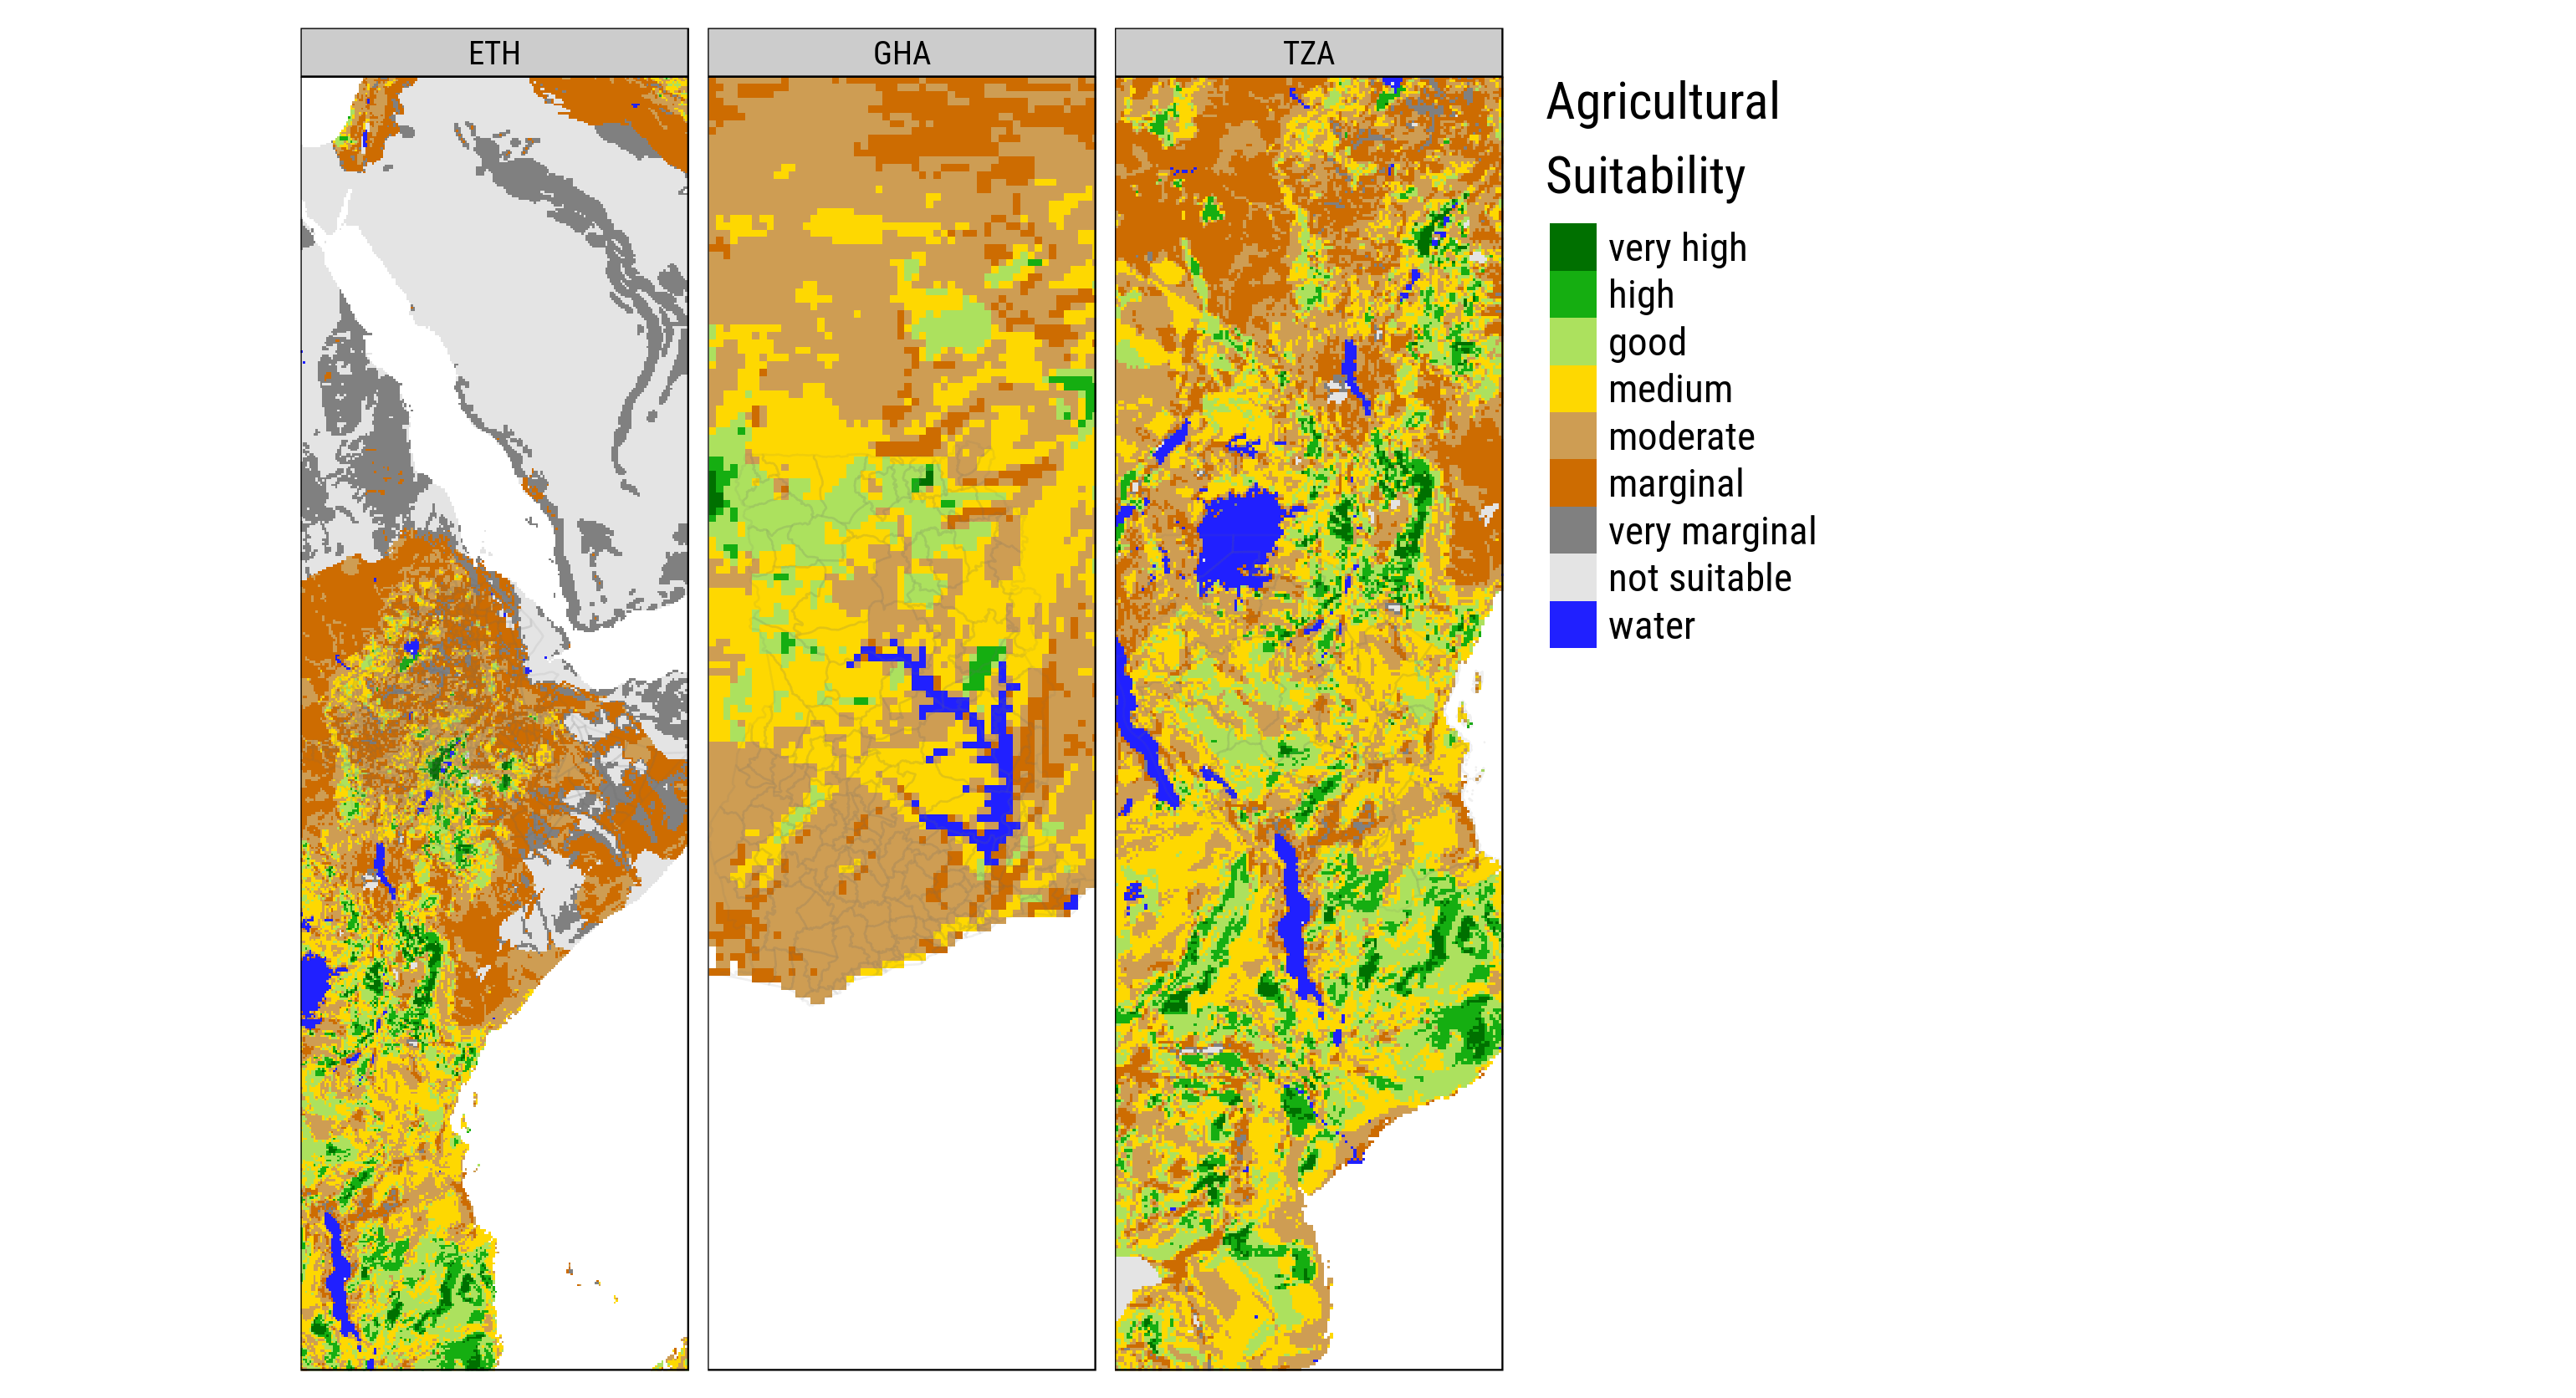
Figure 1.1: Agricultural Suitability (FAO/GAEZ 2007)
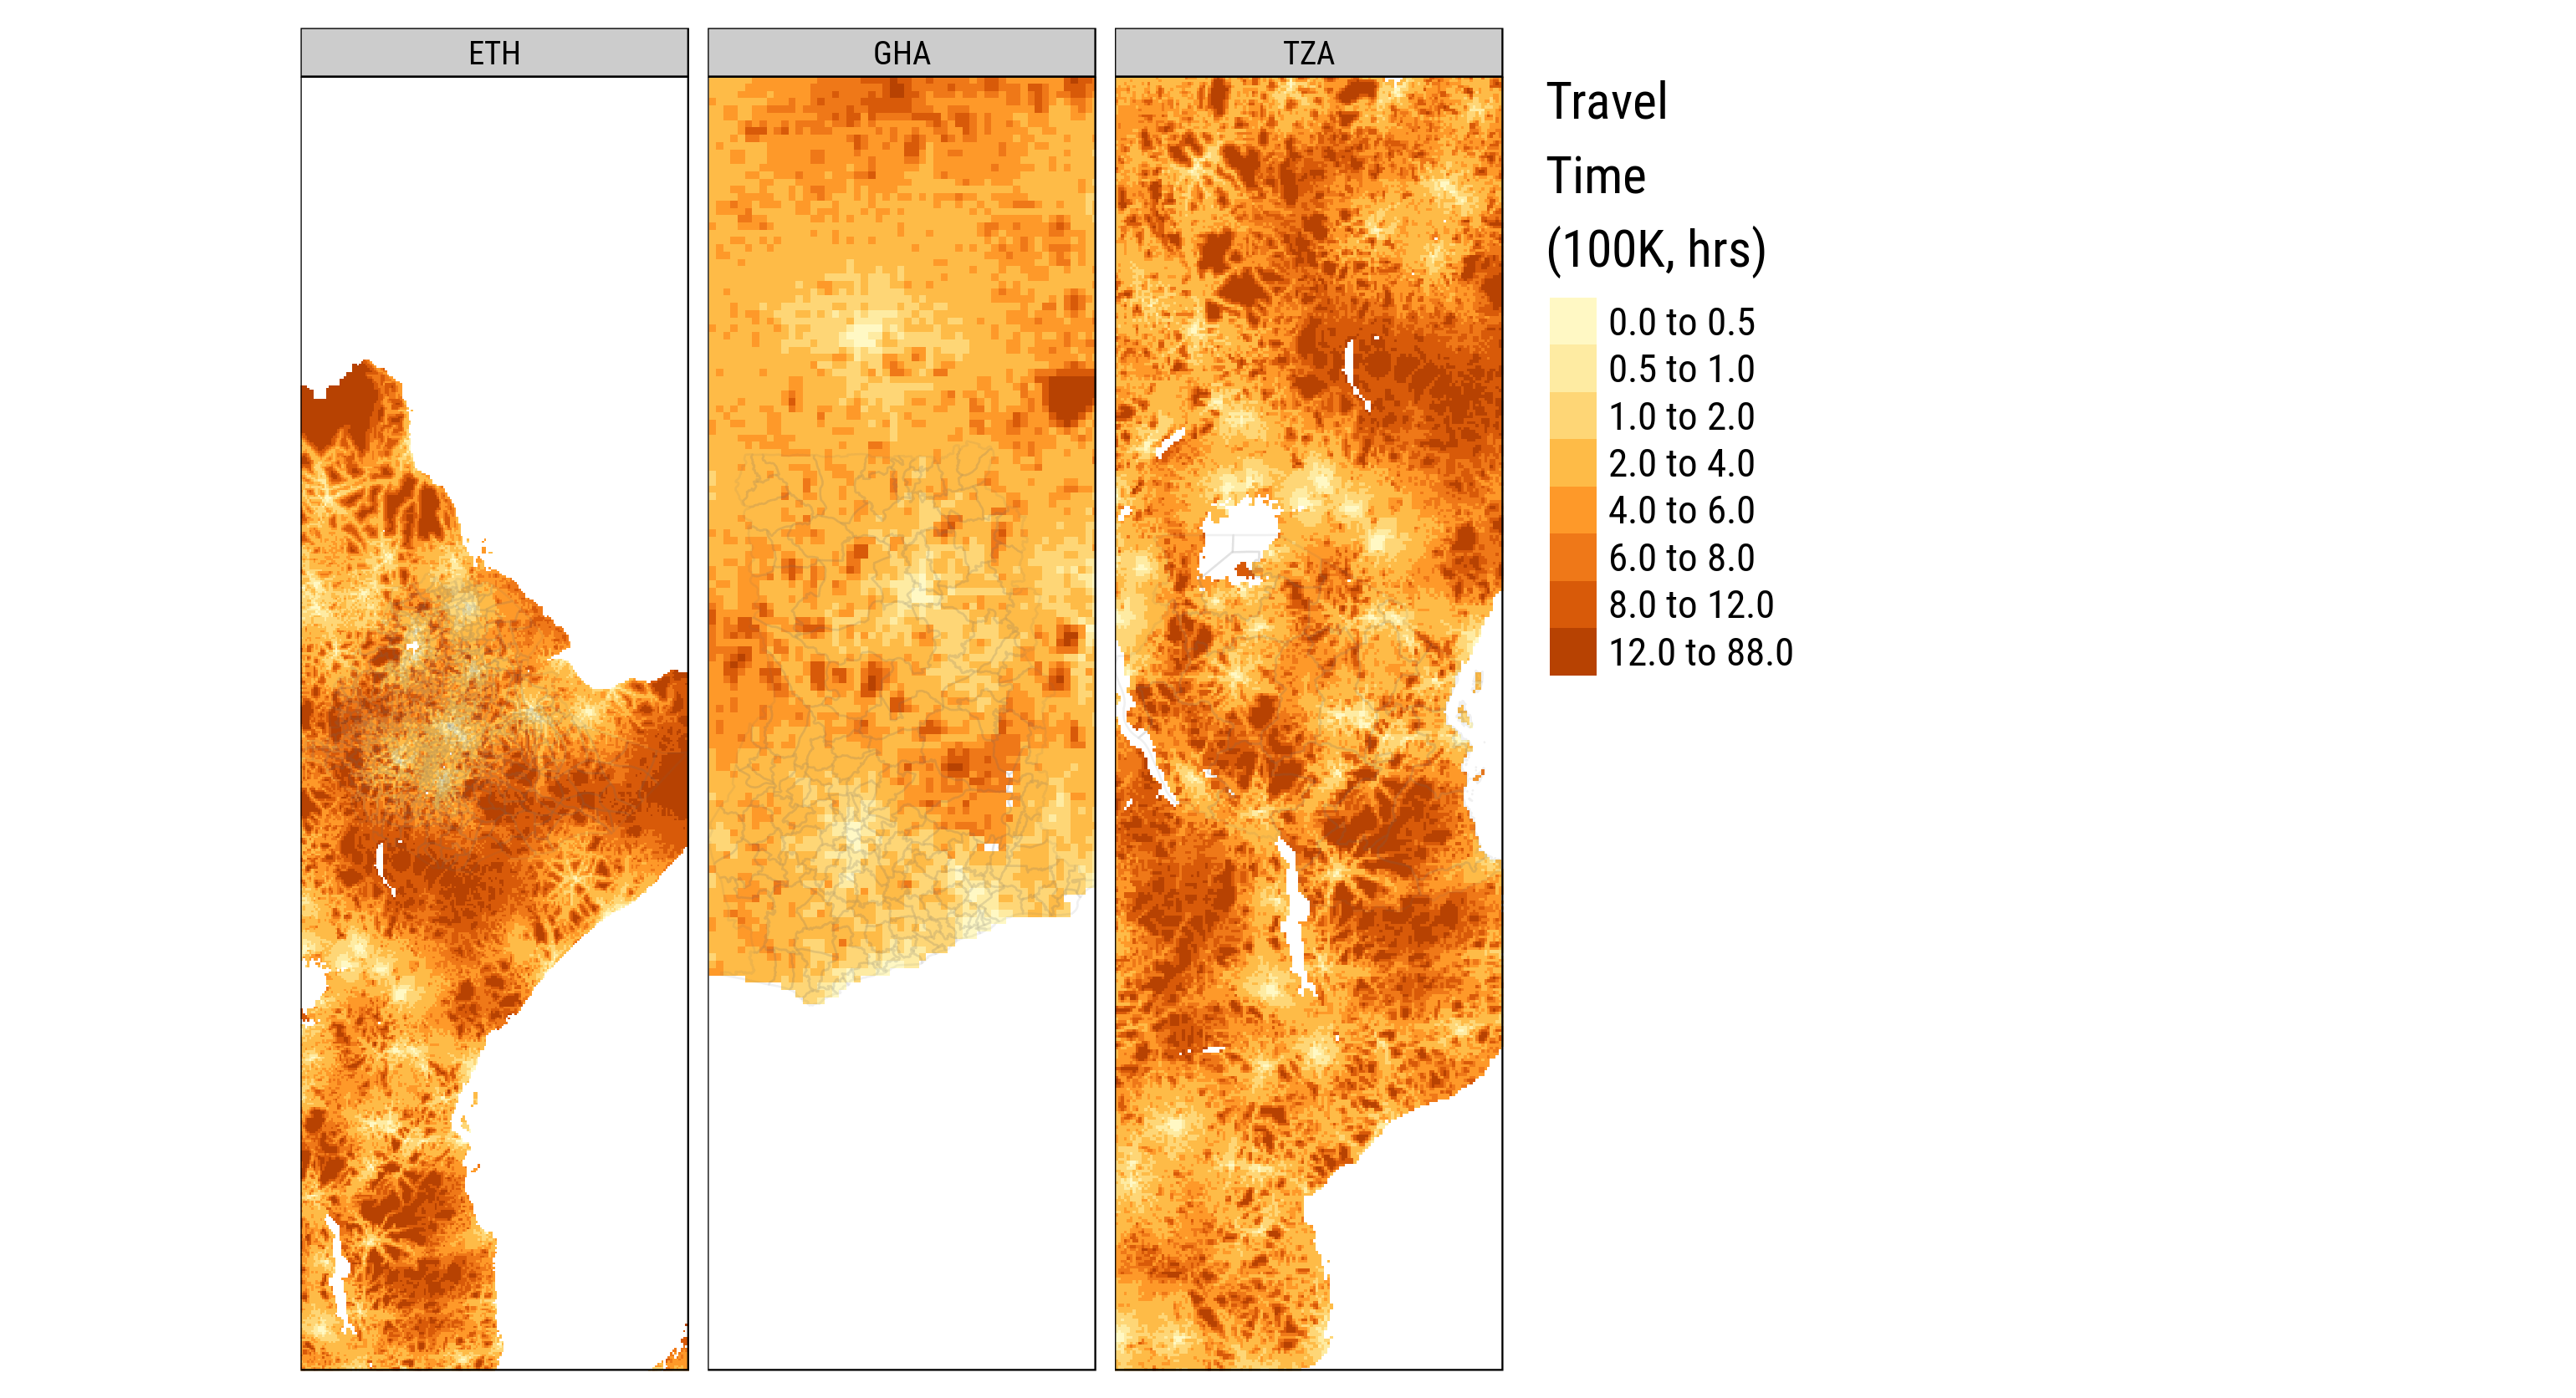
Figure 1.2: Market Access (100K market size, IFPRI 2016)
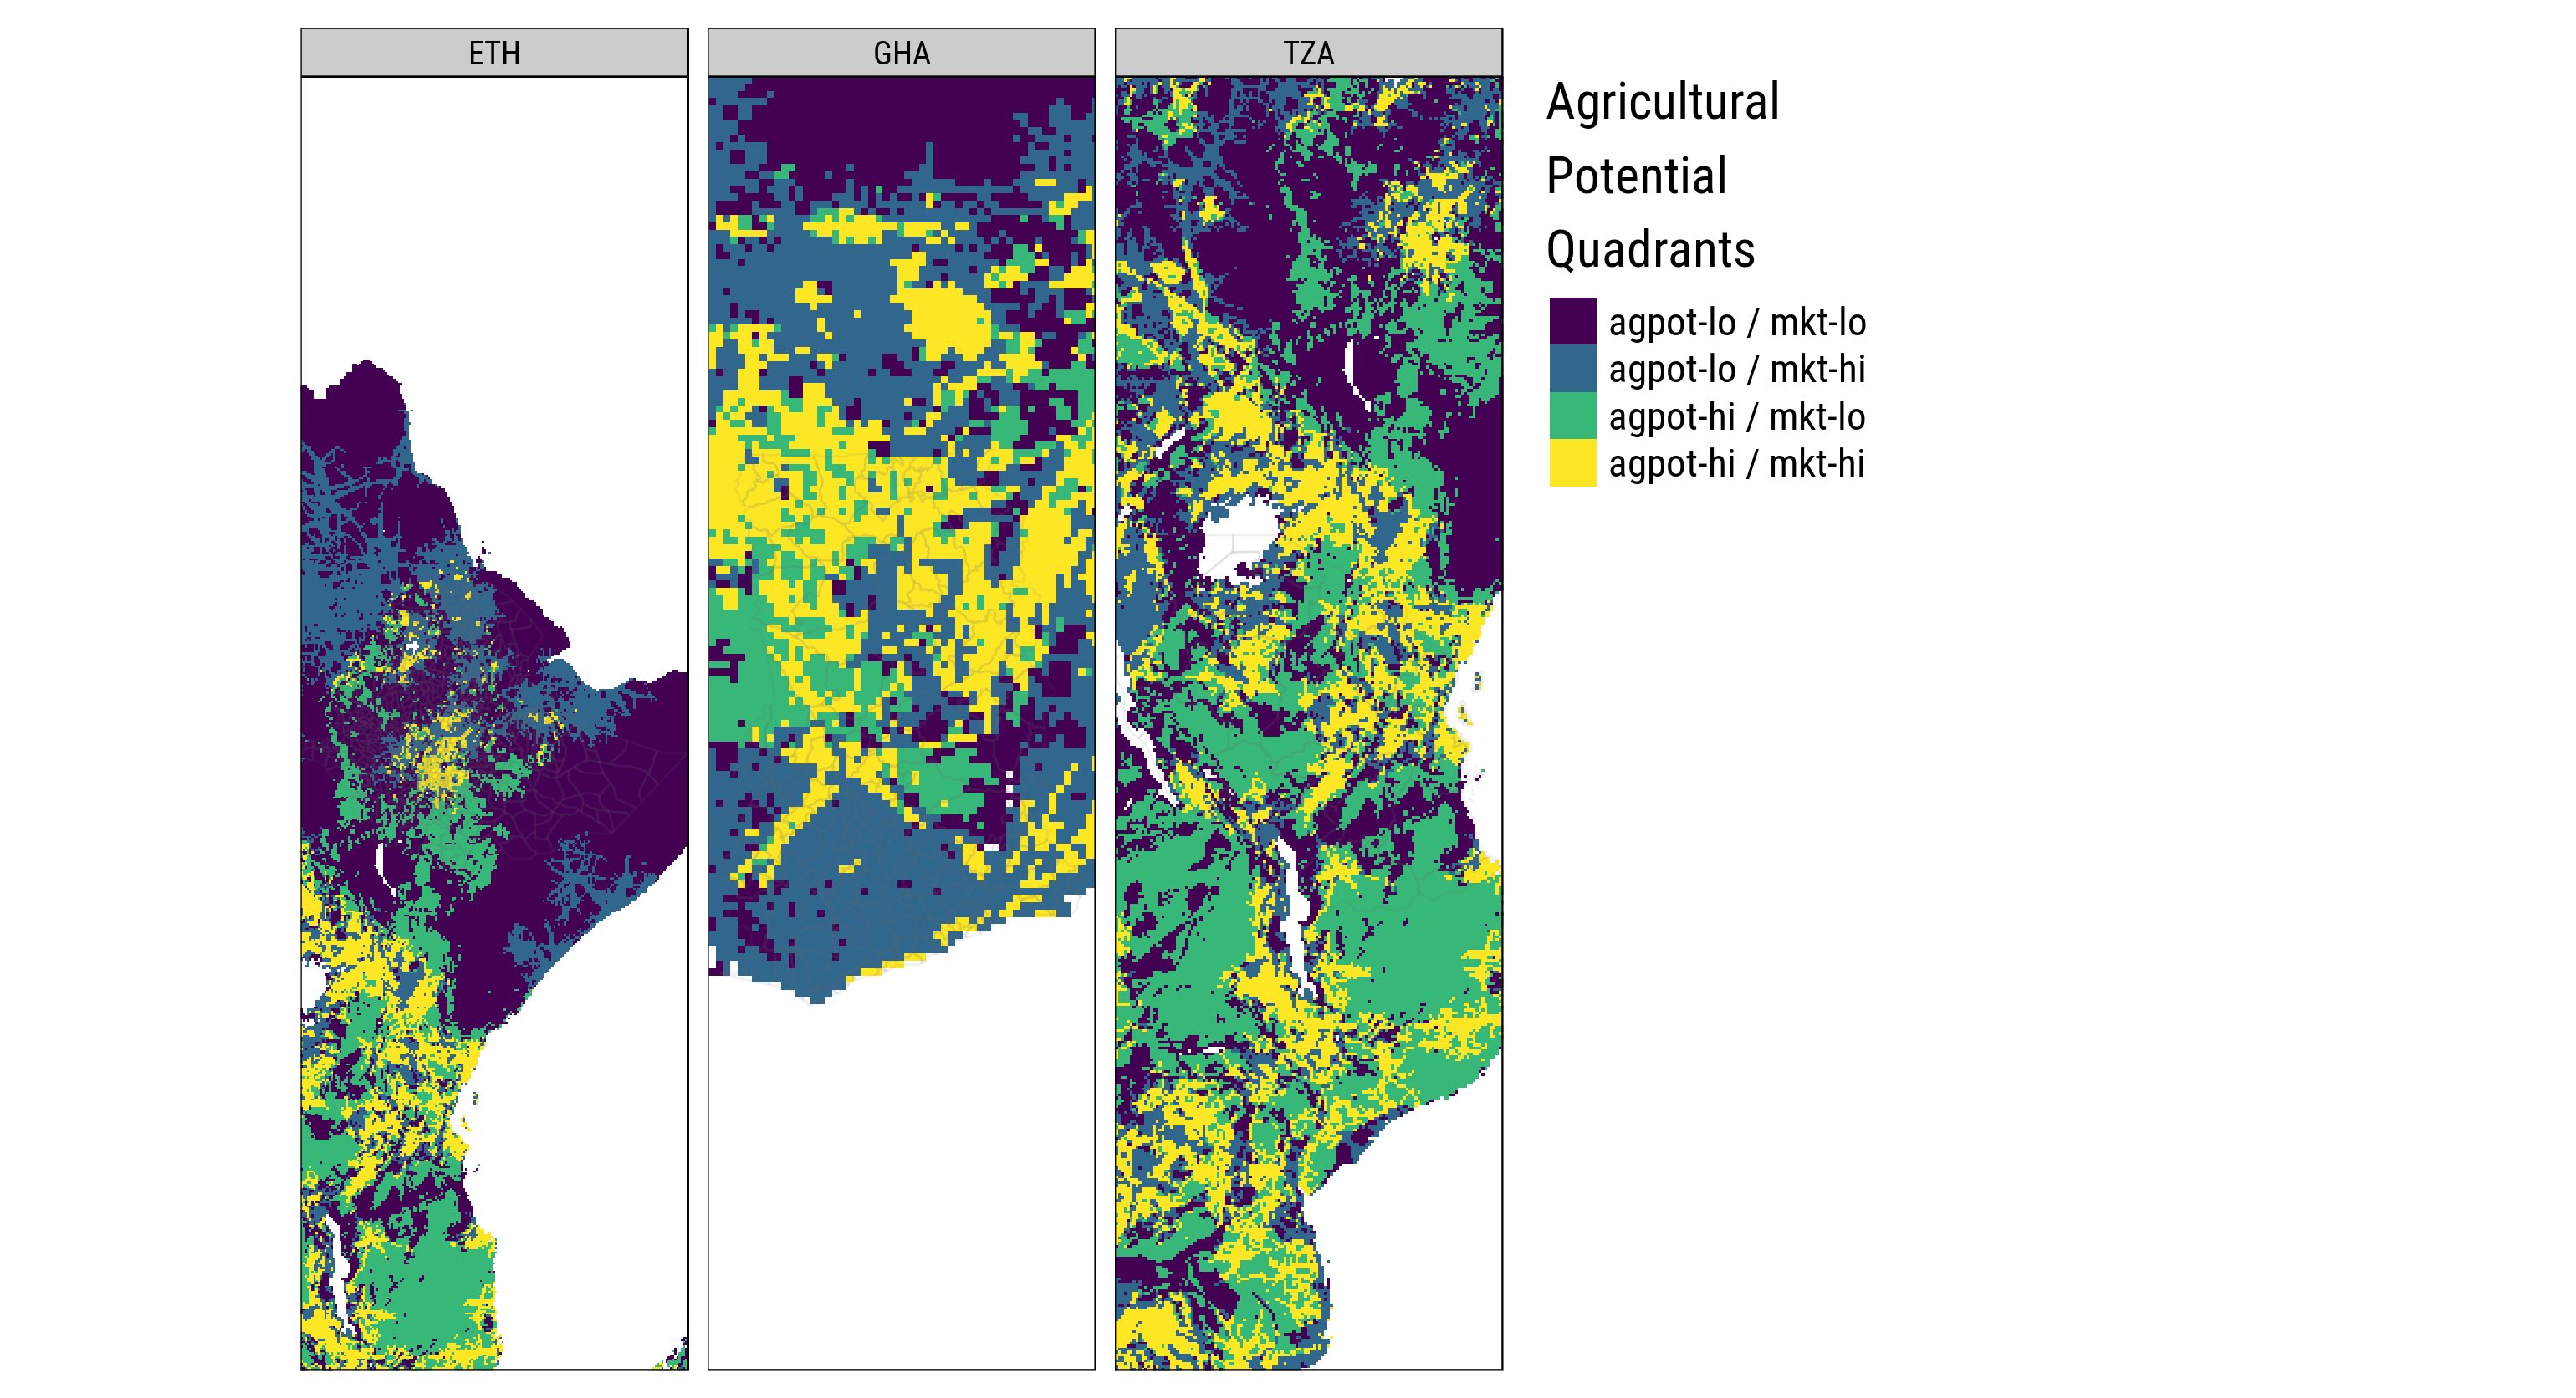
Figure 1.3: Low/High Agricultural Potential Quadrants