4.2 Ghana
Using a combination of biophysical and infrastructure geospatial layers available over sub-Saharan African we identify zones of low/high agricultural potential and low/high market access in Ghana. This basket classification is useful to further characterize small farm holders across all 4 quadrants, and for targeting interventions and investments.
The input layers used for Ghana are as follows.
4.2.1 Agricultural Potential
This measure was derived from FAO/IIASA/GAEZ Crop Suitability Index, 2007 (cereals, rainfed, low-input). Soil suitability classifications are based on knowledge of crop requirements, of prevailing soil conditions, and of applied soil management. In other words, soil suitability procedures quantify to what extent soil conditions match crop requirements under defined input and management circumstances.
Low and high potential areas are further classified as:
- 1-4 values are considered low suitability:
1Land very poorly suited for pasture and at best poorly suited for rainfed crops
2Land poorly suited for pasture and at best poorly suited for rainfed crops
3Lands suited for pasture and at best poorly suited for rainfed crops
4Land suited for rainfed crops and pasture possible
- 5-6 values are considered high suitability:
5Land well suited for rainfed crops and pasture possible
6Prime land suited for rainfed crops and pasture possible
- 809-0 is unsuitable:
-809Protected area
-807Urban area
-805Irrigated area
-801Forest
0Land not suited for agriculture
IIASA/GAEZ crop suitability for Ghana is shown below along with two more recent and higher-resolution remote-sensed land cover classification from ESA/CCI and from USGS/EROS. The fourth map shows areas of low and high agricultural potential based on additional work conducted by BMGF/SDI (this layer was resampled from 10km to 1km resolution and then summarized across districts).

Fig. 3.26: Sources of hi-res Land Cover Maps for Ghana

Fig. 3.27: Sources of hi-res Climatic Constraints for Ghana (e.g. FEWSNET/MODISC6)
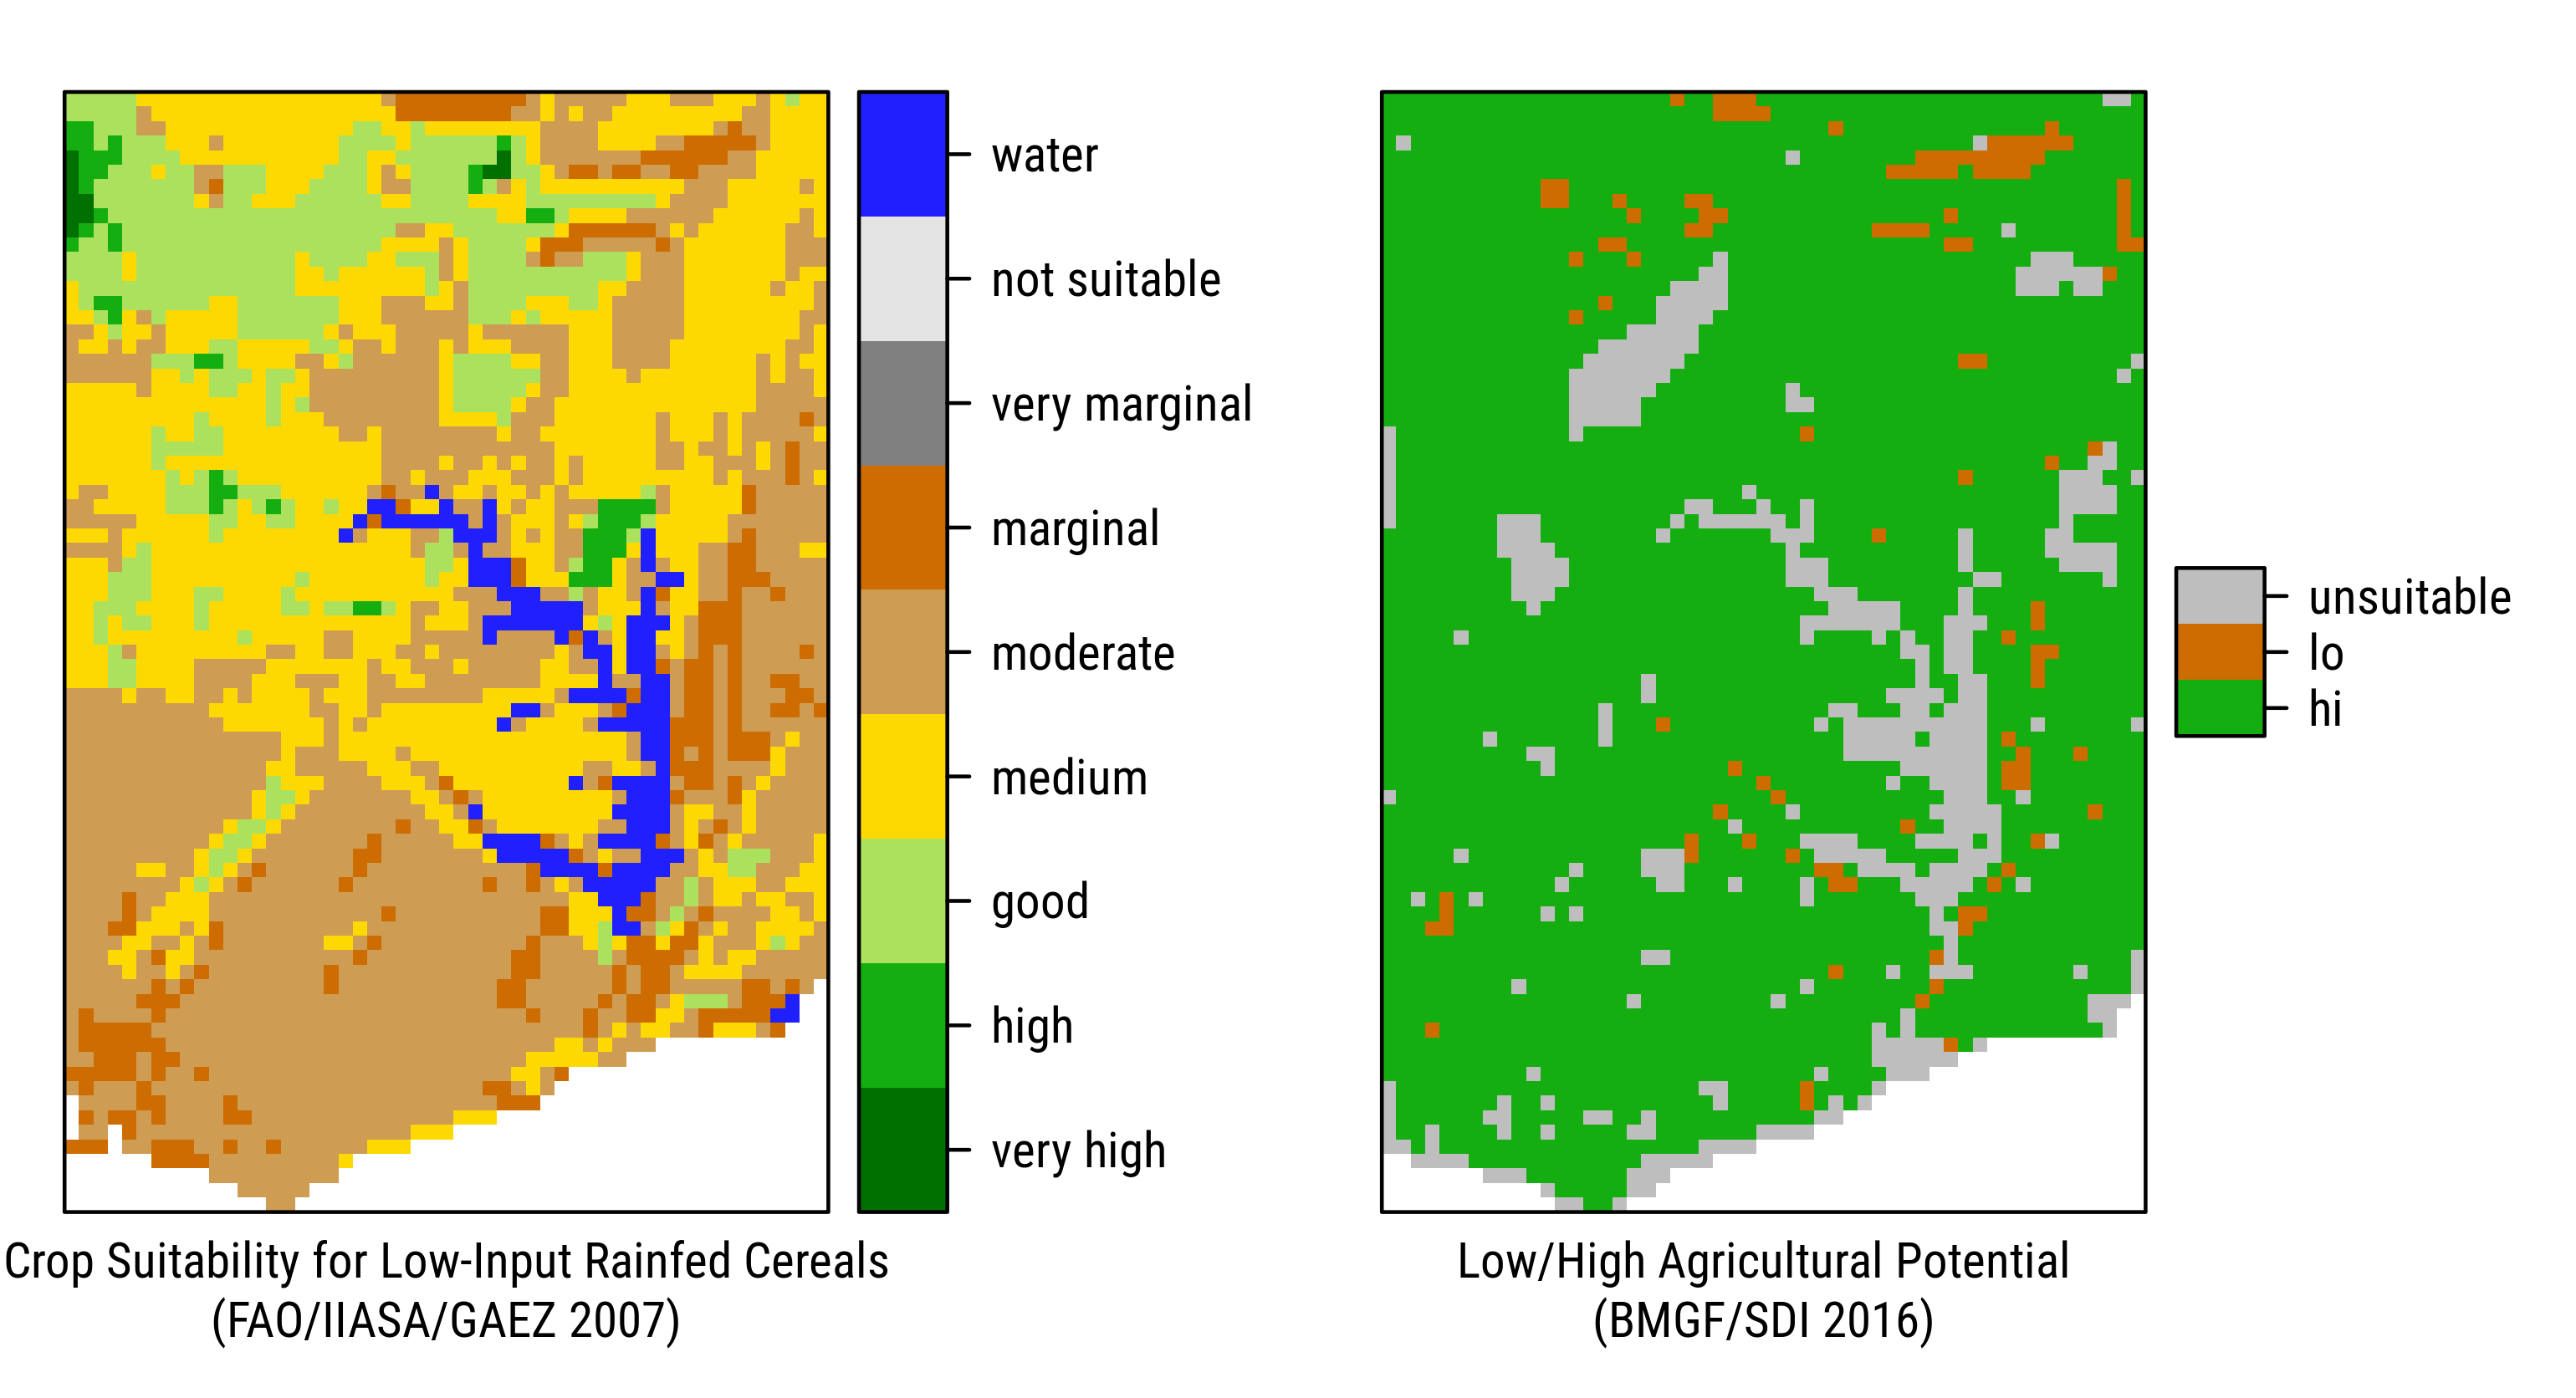
Fig. 3.28: Mapping Ghana’s Agricultural Potential
| Code | Label | Class |
|---|---|---|
| 8 | A | Agriculture |
| 14 | AI | Irrigated agriculture |
| 27 | AP | Cropland and fallow with oil palms |
| 22 | B | Bowe |
| 24 | BL | Agriculture in shallows and recession |
| 21 | DVF | Degraded forest |
| 9 | E | Water bodies |
| 15 | FG | Gallery forest and riparian forest |
| 13 | H | Settlements |
| 78 | OPM | Open mine |
| 12 | SD | Bare soil |
| 28 | SF | Swamp forest |
| 11 | SR | Rocky land |
| 10 | SS | Sandy area |
| 23 | T | Thicket |
| 1 | VF | Forest |
| 7 | VM | Mangrove |
| 3 | VP | Wetland - floodplain |
| 6 | VPI | Plantation |
| 2 | VS | Savanna |
| 32 | VSb | Shrubland |
| 31 | VSH | Herbaceous savanna |
| 29 | VSS | Sahelian short grass savanna |
| 4 | VSt | Steppe |
| 25 | WL | Woodland |
| Code | Label | Class |
|---|---|---|
| 0 | NODAT | No data |
| 10 | CROPR | Cropland, rainfed |
| 11 | HERBC | Herbaceous cover |
| 12 | TROSC | Tree or shrub cover |
| 20 | CRIOP | Cropland, irrigated or post-flooding |
| 30 | MCNVSHC | Mosaic cropland (>50%) / natural vegetation (tree, shrub, herbaceous cover) (<50%) |
| 40 | MNVSHCC | Mosaic natural vegetation (tree, shrub, herbaceous cover) (>50%) / cropland (<50%) |
| 50 | TCBECTO | Tree cover, broadleaved, evergreen, closed to open (>15%) |
| 60 | TCBDCTO | Tree cover, broadleaved, deciduous, closed to open (>15%) |
| 61 | TCBDC | Tree cover, broadleaved, deciduous, closed (>40%) |
| 62 | TCBDO | Tree cover, broadleaved, deciduous, open (15-40%) |
| 70 | TCNECTO | Tree cover, needleleaved, evergreen, closed to open (>15%) |
| 71 | TCNEC | Tree cover, needleleaved, evergreen, closed (>40%) |
| 72 | TCNEO | Tree cover, needleleaved, evergreen, open (15-40%) |
| 80 | TCNDCTO | Tree cover, needleleaved, deciduous, closed to open (>15%) |
| 81 | TCNDC | Tree cover, needleleaved, deciduous, closed (>40%) |
| 82 | TCNDO | Tree cover, needleleaved, deciduous, open (15-40%) |
| 90 | TCMLTAN | Tree cover, mixed leaf type (broadleaved and needleleaved) |
| 100 | MTASHC | Mosaic tree and shrub (>50%) / herbaceous cover (<50%) |
| 110 | MHCTAS | Mosaic herbaceous cover (>50%) / tree and shrub (<50%) |
| 120 | SHRUB | Shrubland |
| 121 | SHRUE | Shrubland evergreen |
| 122 | SHRUD | Shrubland deciduous |
| 130 | GRASS | Grassland |
| 140 | LICAM | Lichens and mosses |
| 150 | SVSHC | Sparse vegetation (tree, shrub, herbaceous cover) (<15%) |
| 151 | SPAT | Sparse tree (<15%) |
| 152 | SPAS | Sparse shrub (<15%) |
| 153 | SPHC | Sparse herbaceous cover (<15%) |
| 160 | TCFFOBW | Tree cover, flooded, fresh or brakish water |
| 170 | TCFSW | Tree cover, flooded, saline water |
| 180 | SOHCFFW | Shrub or herbaceous cover, flooded, fresh/saline/brakish water |
| 190 | URBAA | Urban areas |
| 200 | BAREA | Bare areas |
| 201 | CONBA | Consolidated bare areas |
| 202 | UNCBA | Unconsolidated bare areas |
| 210 | WATEB | Water bodies |
| 220 | PESAI | Permanent snow and ice |
4.2.2 Market Access
Low and high market access areas are defined using a 4 hour travel time threshold. The source is IFPRI/HarvestChoice Travel Time to Markets in Africa South of the Sahara, 2016 at 5-arc-minute (10km) resolution:
100Low access (travel time greater than 4 hours)
200High access (travel time less than or equal to 4 hours)
All layers were resampled to 1km and then we generated dominant classes across Ghana’s districts (as household GPS locations are not available in any of the GLSS rounds).

Fig. 3.29: Travel Time to Nearest Market by Size. Source: IFPRI/HarvestChoice, 2016.
4.2.3 Classification of Farm Holdings across Quadrants
Below is the resulting cross-classification summarized across Ghana’s 170 districts (GLSS6) and 110 districts (GLSS5). Low and high market access districts use a mean travel time to nearest 50K market. In addition all districts that summarize to unsuitable agpot-no are reclassified to low suitability agpot-lo. None of the GLSS survey districts summarize to low suitability, the actual breakdown is given in 3.27.
| Survey | Quadrant | District | Obs. |
|---|---|---|---|
| gha-glss5 | agpot-no / mkt-lo | 4 | 195 |
| agpot-no / mkt-hi | 7 | 1,946 | |
| agpot-lo / mkt-lo | 0 | 0 | |
| agpot-lo / mkt-hi | 0 | 0 | |
| agpot-hi / mkt-lo | 78 | 5,303 | |
| agpot-hi / mkt-hi | 21 | 1,243 | |
| All | 110 | 8,687 | |
| gha-glss6 | agpot-no / mkt-lo | 5 | 367 |
| agpot-no / mkt-hi | 14 | 2,992 | |
| agpot-lo / mkt-lo | 0 | 0 | |
| agpot-lo / mkt-hi | 0 | 0 | |
| agpot-hi / mkt-lo | 117 | 10,210 | |
| agpot-hi / mkt-hi | 34 | 3,203 | |
| All | 170 | 16,772 |
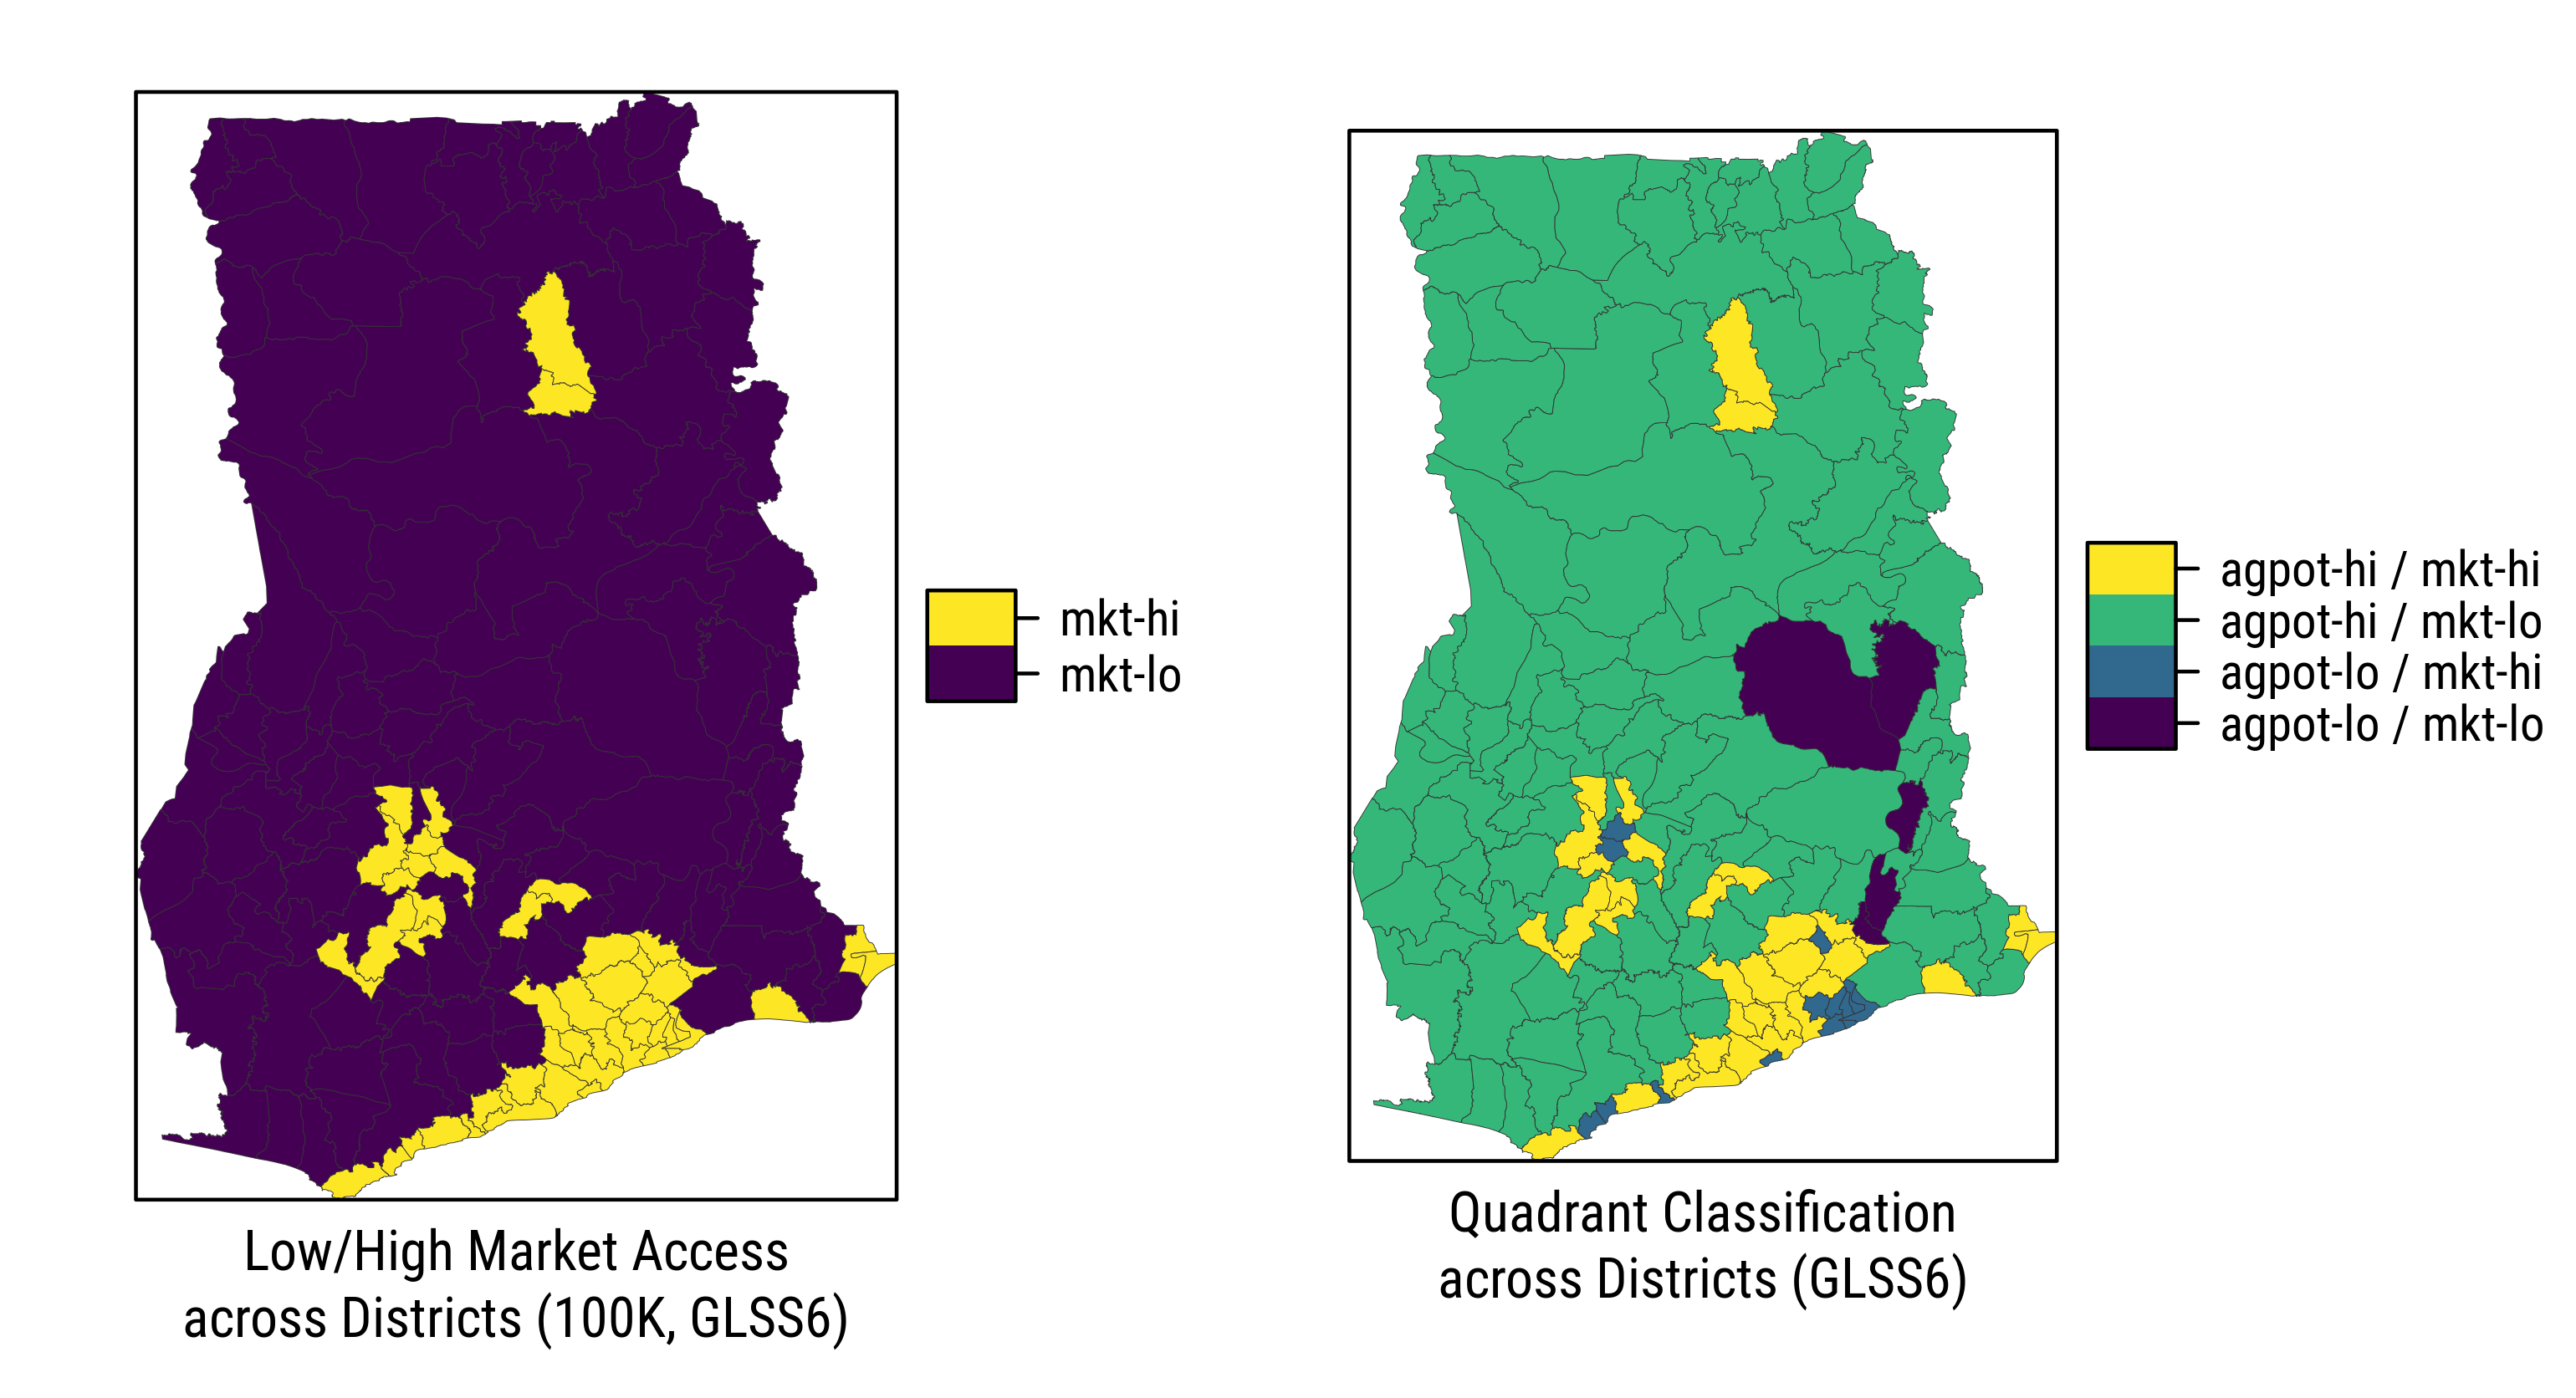
Fig. 3.30: Quadrant Classification across Districts, Ghana 2012/13. Source: authors.
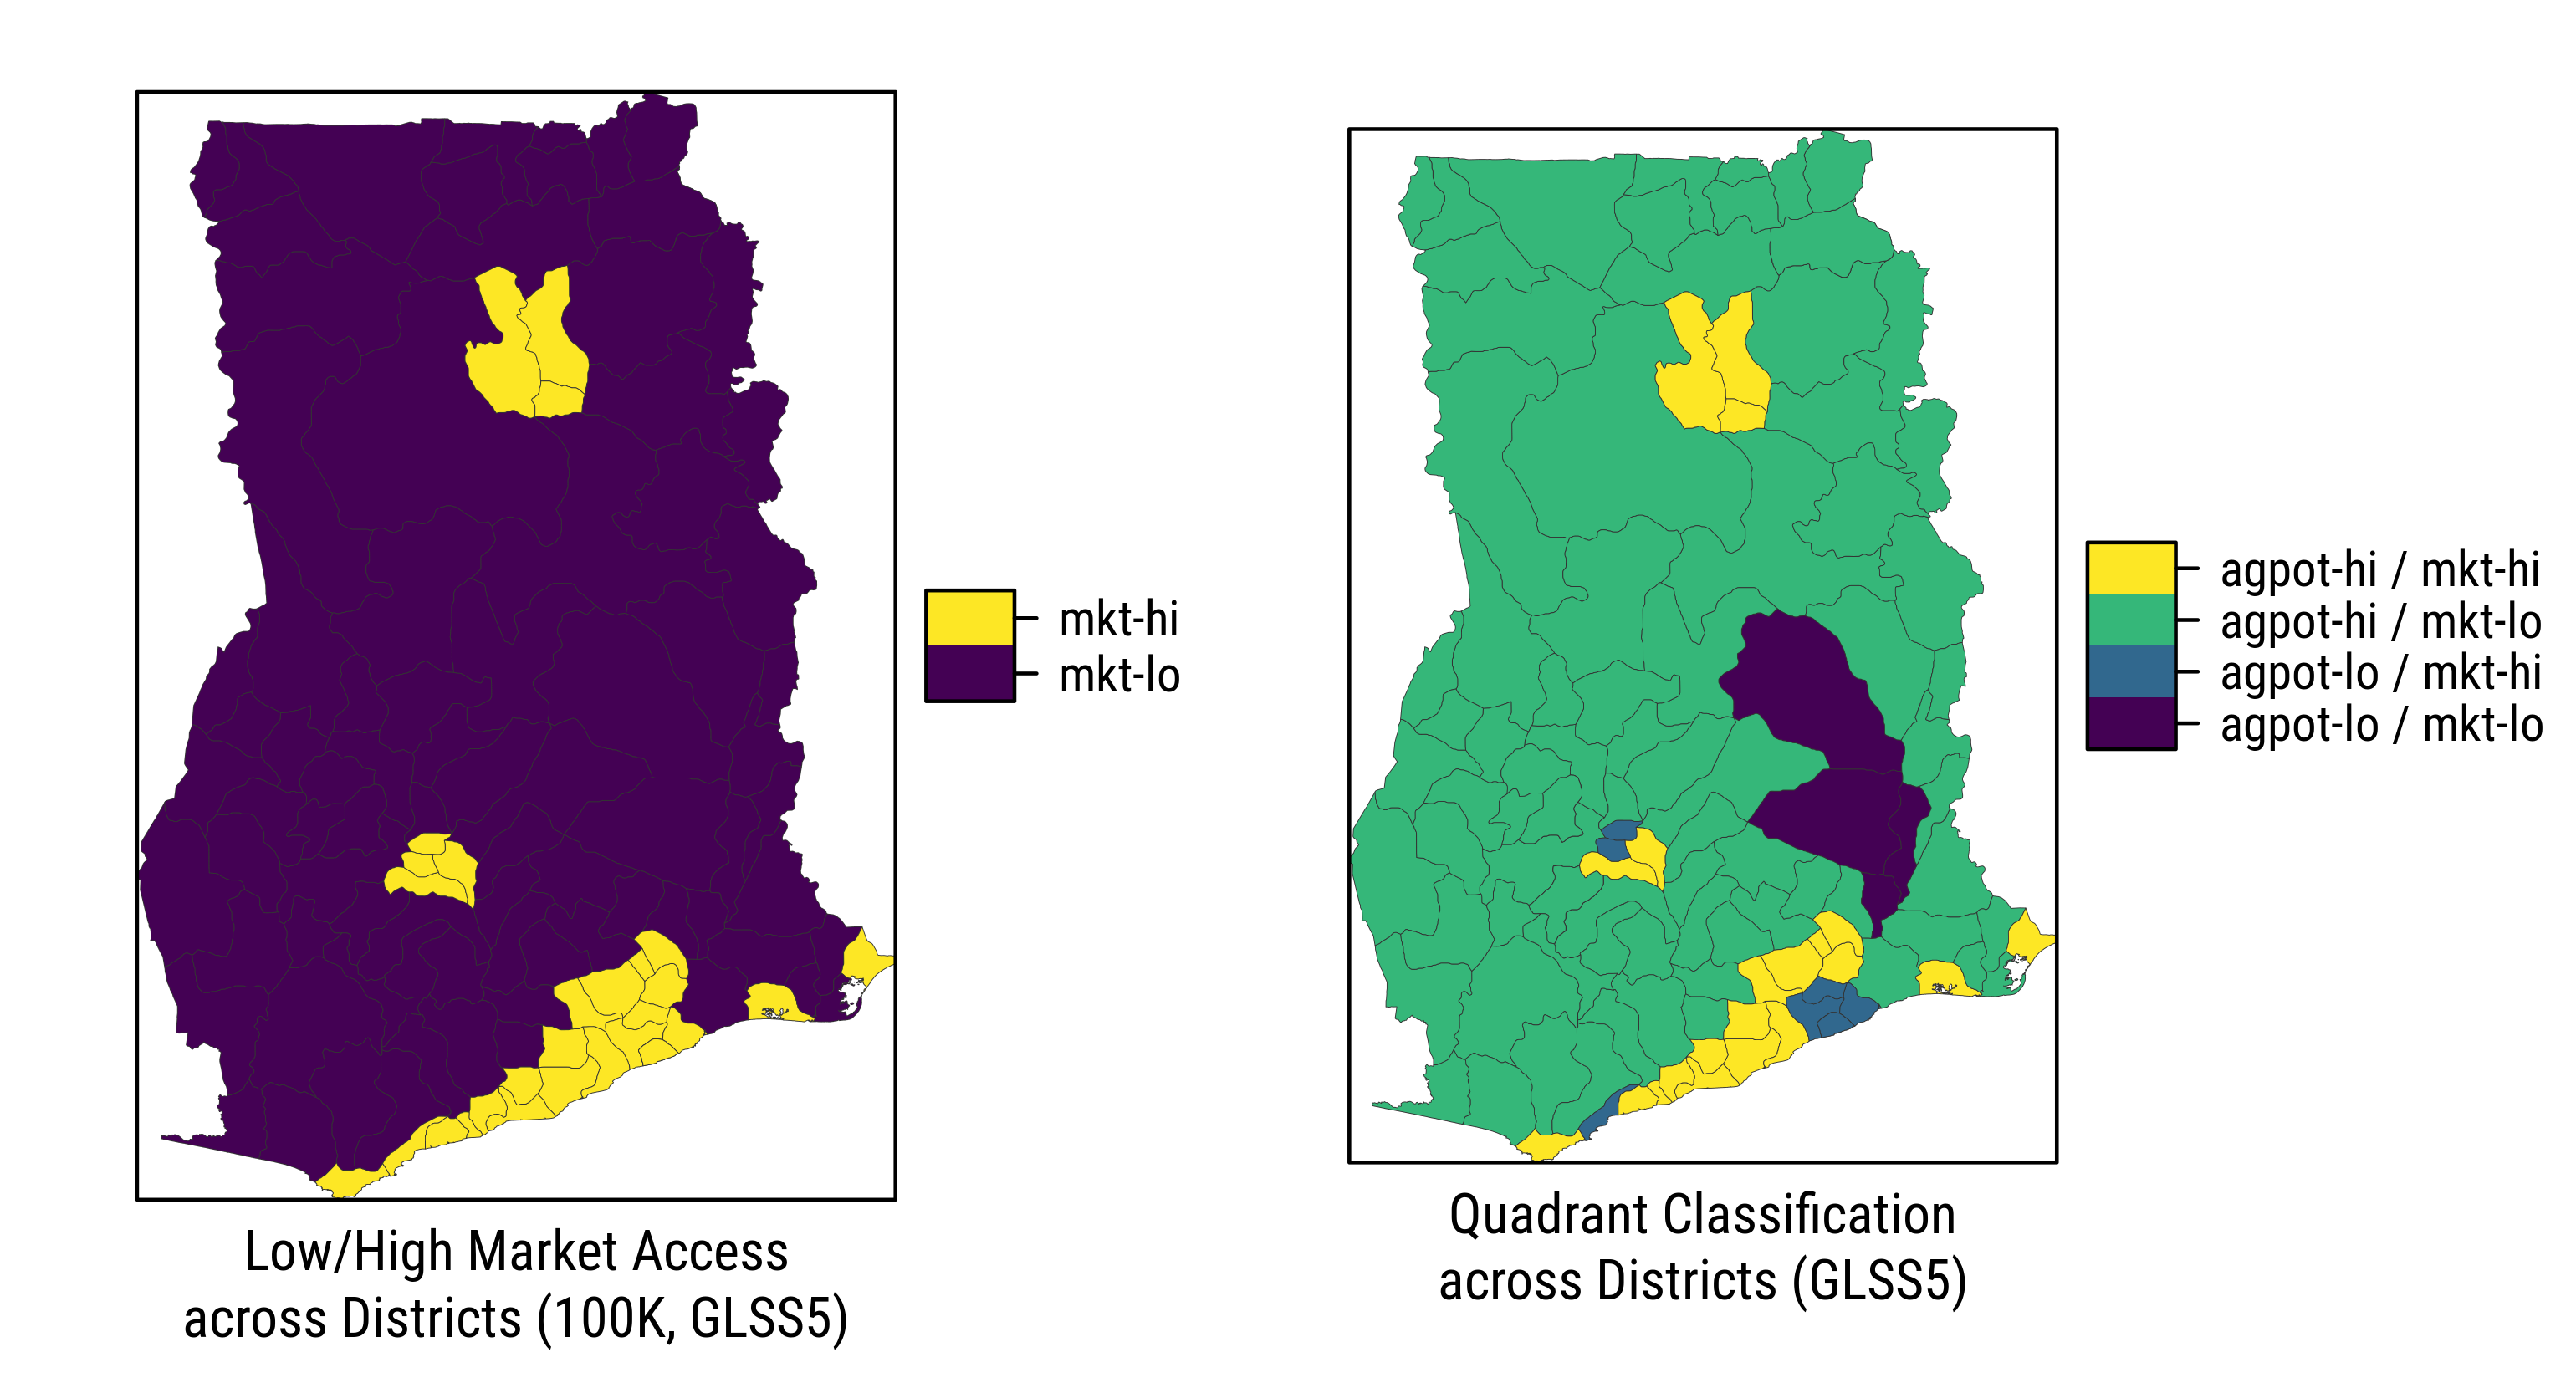
Fig. 3.31: Quadrant Classification across Districts, Ghana 2005/06. Source: authors.
4.2.4 Key Results across Quadrants

Fig. 3.32: Est. Proportions of Farm Holdings across Quadrants (below/above 4 ha)
| Market Access | |||
|---|---|---|---|
| Ag. Potential | mkt-hi | mkt-lo | |
| agpot-hi | mean | 21.6 | 71.3 |
| CI | 18.1 - 25.1 | 67.4 - 75.2 | |
| agpot-lo | mean | 0.0 | 0.0 |
| CI | 0.0 - 0.0 | 0.0 - 0.0 | |
| agpot-no | mean | 4.3 | 2.9 |
| CI | 2.0 - 6.6 | 1.6 - 4.1 | |
Mean and median household characteristics (farms below 4 ha) across the resulting quadrants are estimated in the tables below.
| agpot-lo / mkt-lo | agpot-lo / mkt-hi | agpot-hi / mkt-lo | agpot-hi / mkt-hi | ||||||
|---|---|---|---|---|---|---|---|---|---|
| Variable | est. | std. err. | est. | std. err. | est. | std. err. | est. | std. err. | |
| hhsize_imp | Mean | 5.3 | 0.3 | 4.5 | 0.3 | 4.5 | 0.1 | 4.1 | 0.1 |
| Q50 | 5.0 | 0.5 | 4.0 | 0.5 | 4.0 | 0.0 | 4.0 | 0.0 | |
| agehead | Mean | 46.5 | 1.5 | 48.7 | 2.1 | 47.8 | 0.3 | 49.4 | 0.6 |
| Q50 | 43.0 | 1.8 | 48.0 | 1.8 | 45.0 | 0.3 | 48.0 | 0.5 | |
| (100 * femhead) | Mean | 16.9 | 3.6 | 22.3 | 3.9 | 26.5 | 0.9 | 32.8 | 2.4 |
| Q50 | 0.0 | 0.0 | 0.0 | 0.0 | 0.0 | 0.0 | 0.0 | 0.0 | |
| (100 * widowhead) | Mean | 3.5 | 1.8 | 5.3 | 1.9 | 5.0 | 0.5 | 7.5 | 1.3 |
| Q50 | 0.0 | 0.0 | 0.0 | 0.0 | 0.0 | 0.0 | 0.0 | 0.0 | |
| hhlabor | Mean | 2.6 | 0.2 | 2.5 | 0.1 | 2.2 | 0.0 | 2.1 | 0.1 |
| Q50 | 2.0 | 0.3 | 2.0 | 0.0 | 2.0 | 0.0 | 2.0 | 0.0 | |
| educhead | Mean | 4.5 | 0.6 | 7.3 | 0.3 | 4.6 | 0.1 | 5.3 | 0.2 |
| Q50 | 5.0 | 1.5 | 9.0 | 0.5 | 6.0 | 0.3 | 6.0 | 0.0 | |
| educave15_60 | Mean | 4.3 | 0.5 | 7.0 | 0.2 | 4.8 | 0.1 | 5.5 | 0.1 |
| Q50 | 4.2 | 0.8 | 7.0 | 0.3 | 5.3 | 0.1 | 6.0 | 0.0 | |
| educhigh | Mean | 6.1 | 0.5 | 8.6 | 0.3 | 6.4 | 0.1 | 6.8 | 0.1 |
| Q50 | 6.0 | 0.5 | 9.0 | 0.0 | 6.0 | 0.0 | 7.0 | 0.3 | |
| (100 * ownhome) | Mean | 72.6 | 6.3 | 41.2 | 11.8 | 64.8 | 1.4 | 54.6 | 2.4 |
| Q50 | 100.0 | 0.0 | 0.0 | 25.5 | 100.0 | 0.0 | 100.0 | 0.0 | |
| (100 * cellphone) | Mean | 25.6 | 7.3 | 3.1 | 1.5 | 18.0 | 1.3 | 11.8 | 2.0 |
| Q50 | 0.0 | 0.0 | 0.0 | 0.0 | 0.0 | 0.0 | 0.0 | 0.0 | |
| (100 * telephone) | Mean | 1.4 | 1.4 | 0.0 | 0.0 | 0.4 | 0.1 | 0.4 | 0.2 |
| Q50 | 0.0 | 0.0 | 0.0 | 0.0 | 0.0 | 0.0 | 0.0 | 0.0 | |
| (100 * electricity) | Mean | 42.3 | 7.5 | 78.8 | 4.1 | 44.2 | 2.1 | 68.0 | 3.2 |
| Q50 | 0.0 | 25.5 | 100.0 | 0.0 | 0.0 | 0.0 | 100.0 | 0.0 | |
| distwater | Mean | 3.1 | 1.8 | 0.1 | 0.0 | 2.7 | 0.7 | 0.2 | 0.0 |
| Q50 | 0.1 | 0.0 | 0.0 | 0.0 | 0.1 | 0.0 | 0.1 | 0.0 | |
| distroad | Mean | 0.7 | 0.7 | 0.0 | 0.0 | 0.9 | 0.2 | 0.2 | 0.1 |
| Q50 | 0.0 | 0.0 | 0.0 | 0.0 | 0.0 | 0.0 | 0.0 | 0.0 | |
| distpost | Mean | 30.0 | 6.5 | 5.4 | 0.6 | 17.3 | 0.9 | 9.6 | 1.3 |
| Q50 | 21.6 | 12.5 | 5.0 | 0.0 | 13.0 | 1.0 | 7.0 | 1.0 | |
| distbank | Mean | 25.7 | 4.6 | 5.0 | 0.2 | 13.7 | 0.7 | 9.7 | 1.2 |
| Q50 | 25.0 | 5.9 | 5.0 | 0.0 | 10.0 | 0.8 | 7.0 | 1.3 | |
| disthealth | Mean | 29.3 | 4.5 | 5.0 | 0.6 | 19.9 | 0.9 | 14.3 | 1.5 |
| Q50 | 25.0 | 7.1 | 5.0 | 0.0 | 15.0 | 1.0 | 10.0 | 1.0 | |
| agpot-lo / mkt-lo | agpot-lo / mkt-hi | agpot-hi / mkt-lo | agpot-hi / mkt-hi | ||||||
|---|---|---|---|---|---|---|---|---|---|
| Variable | est. | std. err. | est. | std. err. | est. | std. err. | est. | std. err. | |
| landown | Mean | 0.8 | 0.1 | 1.1 | 0.2 | 1.2 | 0.0 | 0.9 | 0.0 |
| Q50 | 0.4 | 0.2 | 0.8 | 0.2 | 0.8 | 0.1 | 0.4 | 0.1 | |
| croparea_imp | Mean | 1.3 | 0.1 | 1.2 | 0.2 | 1.5 | 0.0 | 1.1 | 0.0 |
| Q50 | 1.1 | 0.2 | 0.8 | 0.2 | 1.2 | 0.1 | 0.8 | 0.0 | |
| agpot-lo / mkt-lo | agpot-lo / mkt-hi | agpot-hi / mkt-lo | agpot-hi / mkt-hi | ||||||
|---|---|---|---|---|---|---|---|---|---|
| Variable | est. | std. err. | est. | std. err. | est. | std. err. | est. | std. err. | |
| aggross | Mean | 1,851.2 | 453.7 | 421.3 | 122.5 | 1,176.4 | 65.2 | 797.7 | 77.9 |
| Q50 | 458.2 | 270.0 | 45.1 | 84.8 | 598.9 | 44.8 | 311.9 | 63.8 | |
| totgross | Mean | 17,753.1 | 2,927.9 | 63,639.2 | 15,169.0 | 14,076.7 | 711.0 | 18,479.3 | 2,010.2 |
| Q50 | 2,769.5 | 968.6 | 13,723.1 | 5,623.0 | 2,000.0 | 111.2 | 2,160.8 | 206.9 | |
| (100 * naggross_sh) | Mean | 47.5 | 5.3 | 85.7 | 3.6 | 46.0 | 1.6 | 59.2 | 2.6 |
| Q50 | 33.2 | 22.3 | 99.9 | 1.4 | 33.2 | 6.4 | 84.8 | 5.1 | |
| cropvalue | Mean | 1,371.9 | 451.8 | 518.9 | 158.2 | 1,194.3 | 58.3 | 798.1 | 74.8 |
| Q50 | 388.3 | 206.6 | 262.2 | 104.7 | 717.8 | 45.6 | 447.1 | 68.8 | |
| cropsales | Mean | 412.1 | 125.8 | 248.8 | 90.1 | 663.9 | 32.6 | 422.4 | 49.3 |
| Q50 | 16.7 | 92.7 | 60.0 | 24.2 | 230.0 | 27.1 | 130.5 | 35.7 | |
| (100 * cropsales_sh) | Mean | 31.0 | 5.8 | 18.5 | 5.5 | 37.4 | 1.3 | 33.2 | 2.1 |
| Q50 | 12.7 | 11.7 | 0.0 | 9.5 | 31.5 | 3.3 | 23.6 | 6.1 | |
| totlvstprod | Mean | 1,032.7 | 381.8 | 44.9 | 29.9 | 168.1 | 39.8 | 122.5 | 41.6 |
| Q50 | 27.5 | 28.2 | 0.0 | 0.6 | 0.0 | 0.7 | 0.0 | 0.0 | |
| totlivsold | Mean | 988.2 | 376.1 | 35.8 | 23.2 | 155.2 | 39.5 | 114.4 | 40.6 |
| Q50 | 0.0 | 16.3 | 0.0 | 0.0 | 0.0 | 0.0 | 0.0 | 0.0 | |
| agpot-lo / mkt-lo | agpot-lo / mkt-hi | agpot-hi / mkt-lo | agpot-hi / mkt-hi | ||||||
|---|---|---|---|---|---|---|---|---|---|
| Variable | est. | std. err. | est. | std. err. | est. | std. err. | est. | std. err. | |
| (1000 * TLU_horse) | Mean | 0 | 0 | 0 | 0 | 3 | 0 | 0 | 0 |
| Q50 | 0 | 0 | 0 | 0 | 0 | 0 | 0 | 0 | |
| (1000 * TLU_cattle) | Mean | 31 | 11 | 28 | 20 | 23 | 2 | 4 | 2 |
| Q50 | 0 | 0 | 0 | 0 | 0 | 0 | 0 | 0 | |
| (1000 * TLU_pigs) | Mean | 9 | 4 | 0 | 0 | 7 | 1 | 1 | 0 |
| Q50 | 0 | 0 | 0 | 0 | 0 | 0 | 0 | 0 | |
| (1000 * TLU_sheep) | Mean | 29 | 4 | 15 | 4 | 32 | 1 | 22 | 2 |
| Q50 | 0 | 2 | 0 | 0 | 0 | 0 | 0 | 0 | |
| (1000 * TLU_small) | Mean | 12 | 1 | 4 | 1 | 10 | 0 | 7 | 1 |
| Q50 | 4 | 3 | 0 | 0 | 3 | 1 | 0 | 0 | |
| (1000 * TLU_total) | Mean | 80 | 15 | 48 | 20 | 74 | 3 | 34 | 3 |
| Q50 | 22 | 6 | 0 | 0 | 14 | 2 | 4 | 2 | |
| agpot-lo / mkt-lo | agpot-lo / mkt-hi | agpot-hi / mkt-lo | agpot-hi / mkt-hi | ||||||
|---|---|---|---|---|---|---|---|---|---|
| Variable | est. | std. err. | est. | std. err. | est. | std. err. | est. | std. err. | |
| (100 * seeds) | Mean | 18 | 4 | 14 | 7 | 17 | 1 | 13 | 2 |
| Q50 | 0 | 0 | 0 | 0 | 0 | 0 | 0 | 0 | |
| (100 * fert_any) | Mean | 26 | 5 | 13 | 3 | 42 | 1 | 28 | 3 |
| Q50 | 0 | 0 | 0 | 0 | 0 | 0 | 0 | 0 | |
| (100 * fert_inorg) | Mean | 19 | 5 | 9 | 4 | 32 | 2 | 19 | 3 |
| Q50 | 0 | 0 | 0 | 0 | 0 | 0 | 0 | 0 | |
| (100 * fert_org) | Mean | 7 | 3 | 5 | 2 | 12 | 1 | 10 | 2 |
| Q50 | 0 | 0 | 0 | 0 | 0 | 0 | 0 | 0 | |
| (100 * herb) | Mean | 56 | 7 | 46 | 10 | 56 | 2 | 50 | 3 |
| Q50 | 100 | 0 | 0 | 26 | 100 | 0 | 0 | 26 | |
| (100 * pest) | Mean | 9 | 4 | 21 | 3 | 31 | 2 | 23 | 2 |
| Q50 | 0 | 0 | 0 | 0 | 0 | 0 | 0 | 0 | |
| (100 * irr) | Mean | 1 | 1 | 0 | 0 | 1 | 0 | 1 | 0 |
| Q50 | 0 | 0 | 0 | 0 | 0 | 0 | 0 | 0 | |
| (100 * fuel) | Mean | 20 | 6 | 10 | 3 | 30 | 1 | 22 | 2 |
| Q50 | 0 | 0 | 0 | 0 | 0 | 0 | 0 | 0 | |
| (100 * hired_labor) | Mean | 45 | 7 | 19 | 7 | 48 | 2 | 38 | 3 |
| Q50 | 0 | 26 | 0 | 0 | 0 | 26 | 0 | 0 | |
Below are estimated distributions of key characteristics for farms below 4 ha as of 2012/13.

Fig. 3.33: Est. Farm Size and Cultivated Area of Farm Holdings below 4 ha across Quadrants (2012/13, ha)

Fig. 3.34: Est. Gross Farm Income and Crop Sales for Farm Holdings below 4 ha across Quadrants (2012/13, ’000 Cedis)

Fig. 3.35: Est. Input Uses for Farm Holdings below 4 ha across Quadrants (2012/13, percent of farms)

Fig. 3.35: Est. Input Uses for Farm Holdings below 4 ha across Quadrants (2012/13, percent of farms)
4.2.5 Development Domain and Farm Types
In this section we combine results from the farm typology developed in Section 3 with the spatial dimensions outlined above (FAO/GAEZ agricultural suitability and market access using IFPRI/HarvestChoice travel time to nearest 100K market).

Fig. 3.36: Est. Proportions of Farm Holdings across Combined Categories (farms below 4 ha)
| Farm Type | ||||||
|---|---|---|---|---|---|---|
| Development Domain | subs. | trans. | pre-comm. | specd. comm. | divf. comm. | |
| agpot-lo / mkt-lo | mean | 0.3 | 1.0 | 0.4 | 0.6 | 0.3 |
| CI | 0.1 - 0.5 | 0.5 - 1.5 | 0.1 - 0.8 | 0.2 - 1.0 | 0.1 - 0.5 | |
| agpot-lo / mkt-hi | mean | 0.1 | 3.3 | 0.2 | 0.1 | 0.6 |
| CI | 0.0 - 0.2 | 1.7 - 5.0 | 0.0 - 0.5 | 0.0 - 0.3 | 0.0 - 1.2 | |
| agpot-hi / mkt-lo | mean | 6.5 | 24.6 | 11.2 | 18.0 | 11.1 |
| CI | 5.4 - 7.5 | 21.9 - 27.2 | 9.7 - 12.8 | 15.9 - 20.1 | 9.5 - 12.7 | |
| agpot-hi / mkt-hi | mean | 1.3 | 10.0 | 2.6 | 3.9 | 3.9 |
| CI | 0.9 - 1.7 | 8.1 - 11.9 | 1.8 - 3.4 | 2.9 - 5.0 | 2.8 - 5.0 | |
Mean and median household characteristics (farms below 4 ha) across the resulting quadrants are estimated in the tables below.
| subs. | trans. | pre-comm. | specd. comm. | divf. comm. | |||||||
|---|---|---|---|---|---|---|---|---|---|---|---|
| Variable | est. | std. err. | est. | std. err. | est. | std. err. | est. | std. err. | est. | std. err. | |
| hhsize_imp | Mean | 4.2 | 0.1 | 4.5 | 0.1 | 4.8 | 0.1 | 4.3 | 0.1 | 4.4 | 0.1 |
| Q50 | 4.0 | 0.0 | 4.0 | 0.0 | 4.0 | 0.3 | 4.0 | 0.0 | 4.0 | 0.0 | |
| agehead | Mean | 49.6 | 0.7 | 48.9 | 0.4 | 47.0 | 0.6 | 47.4 | 0.5 | 48.1 | 0.7 |
| Q50 | 48.0 | 1.3 | 47.0 | 0.5 | 45.0 | 1.0 | 45.0 | 0.5 | 46.0 | 0.8 | |
| (100 * femhead) | Mean | 30.1 | 2.2 | 33.6 | 1.4 | 20.9 | 1.7 | 20.7 | 1.5 | 26.2 | 2.1 |
| Q50 | 0.0 | 0.0 | 0.0 | 0.0 | 0.0 | 0.0 | 0.0 | 0.0 | 0.0 | 0.0 | |
| (100 * widowhead) | Mean | 6.4 | 1.4 | 6.4 | 0.9 | 5.6 | 1.1 | 3.8 | 0.7 | 4.7 | 1.0 |
| Q50 | 0.0 | 0.0 | 0.0 | 0.0 | 0.0 | 0.0 | 0.0 | 0.0 | 0.0 | 0.0 | |
| hhlabor | Mean | 2.1 | 0.1 | 2.3 | 0.0 | 2.3 | 0.1 | 2.1 | 0.1 | 2.2 | 0.1 |
| Q50 | 2.0 | 0.0 | 2.0 | 0.0 | 2.0 | 0.0 | 2.0 | 0.0 | 2.0 | 0.0 | |
| educhead | Mean | 3.1 | 0.2 | 5.6 | 0.1 | 3.6 | 0.2 | 4.1 | 0.1 | 5.8 | 0.2 |
| Q50 | 0.0 | 0.0 | 6.0 | 0.0 | 2.0 | 1.0 | 5.0 | 0.5 | 6.0 | 0.0 | |
| educave15_60 | Mean | 3.8 | 0.2 | 5.8 | 0.1 | 3.8 | 0.1 | 4.3 | 0.1 | 5.8 | 0.1 |
| Q50 | 3.5 | 0.4 | 6.0 | 0.0 | 3.9 | 0.3 | 4.5 | 0.2 | 6.0 | 0.0 | |
| educhigh | Mean | 5.3 | 0.2 | 7.3 | 0.1 | 5.5 | 0.1 | 5.8 | 0.1 | 7.3 | 0.1 |
| Q50 | 6.0 | 0.0 | 8.0 | 0.3 | 6.0 | 0.0 | 6.0 | 0.0 | 8.0 | 0.3 | |
| (100 * ownhome) | Mean | 74.5 | 3.2 | 53.1 | 1.8 | 71.9 | 2.0 | 70.2 | 1.7 | 59.9 | 2.6 |
| Q50 | 100.0 | 0.0 | 100.0 | 0.0 | 100.0 | 0.0 | 100.0 | 0.0 | 100.0 | 0.0 | |
| (100 * cellphone) | Mean | 22.8 | 2.2 | 13.0 | 1.2 | 20.4 | 2.1 | 18.2 | 2.1 | 14.6 | 1.8 |
| Q50 | 0.0 | 0.0 | 0.0 | 0.0 | 0.0 | 0.0 | 0.0 | 0.0 | 0.0 | 0.0 | |
| (100 * telephone) | Mean | 0.0 | 0.0 | 0.5 | 0.1 | 0.3 | 0.2 | 0.3 | 0.1 | 0.4 | 0.2 |
| Q50 | 0.0 | 0.0 | 0.0 | 0.0 | 0.0 | 0.0 | 0.0 | 0.0 | 0.0 | 0.0 | |
| (100 * electricity) | Mean | 29.3 | 3.2 | 65.9 | 1.6 | 29.8 | 3.1 | 34.3 | 2.7 | 59.5 | 3.1 |
| Q50 | 0.0 | 0.0 | 100.0 | 0.0 | 0.0 | 0.0 | 0.0 | 0.0 | 100.0 | 0.0 | |
| distwater | Mean | 0.6 | 0.2 | 2.0 | 0.5 | 1.2 | 0.3 | 3.7 | 1.9 | 1.9 | 0.8 |
| Q50 | 0.2 | 0.0 | 0.1 | 0.0 | 0.2 | 0.0 | 0.1 | 0.0 | 0.1 | 0.0 | |
| distroad | Mean | 1.6 | 0.4 | 0.3 | 0.1 | 1.2 | 0.3 | 0.9 | 0.2 | 0.3 | 0.1 |
| Q50 | 0.0 | 0.0 | 0.0 | 0.0 | 0.0 | 0.0 | 0.0 | 0.0 | 0.0 | 0.0 | |
| distpost | Mean | 16.0 | 1.1 | 12.7 | 0.8 | 18.6 | 1.2 | 18.3 | 1.3 | 14.0 | 1.0 |
| Q50 | 11.0 | 0.5 | 9.0 | 0.8 | 14.0 | 0.9 | 14.0 | 1.0 | 10.0 | 1.0 | |
| distbank | Mean | 13.2 | 1.0 | 10.0 | 0.6 | 16.1 | 1.0 | 15.4 | 1.0 | 11.4 | 0.7 |
| Q50 | 10.0 | 0.8 | 7.0 | 1.0 | 12.0 | 1.0 | 11.0 | 1.0 | 8.0 | 0.8 | |
| disthealth | Mean | 18.2 | 1.2 | 15.7 | 0.9 | 20.8 | 1.2 | 21.0 | 1.1 | 18.1 | 1.0 |
| Q50 | 12.0 | 1.3 | 10.0 | 1.0 | 15.0 | 1.0 | 17.0 | 0.8 | 15.0 | 1.0 | |
| subs. | trans. | pre-comm. | specd. comm. | divf. comm. | |||||||
|---|---|---|---|---|---|---|---|---|---|---|---|
| Variable | est. | std. err. | est. | std. err. | est. | std. err. | est. | std. err. | est. | std. err. | |
| landown | Mean | 0.8 | 0.1 | 1.0 | 0.0 | 1.1 | 0.1 | 1.3 | 0.1 | 1.1 | 0.1 |
| Q50 | 0.5 | 0.1 | 0.8 | 0.1 | 0.8 | 0.1 | 1.2 | 0.1 | 0.8 | 0.1 | |
| landshare | Mean | 0.4 | 0.1 | 0.8 | 0.1 | 0.7 | 0.1 | 0.7 | 0.1 | 0.7 | 0.1 |
| Q50 | 0.4 | 0.3 | 0.8 | 0.0 | 0.4 | 0.2 | 0.4 | 0.1 | 0.8 | 0.1 | |
| landrent | Mean | 1.0 | 0.2 | 1.0 | 0.2 | 1.0 | 0.2 | 0.8 | 0.2 | 1.2 | 0.3 |
| Q50 | 1.0 | 0.3 | 0.8 | 0.0 | 0.8 | 0.1 | 0.4 | 0.1 | 0.8 | 0.4 | |
| croparea_imp | Mean | 1.0 | 0.0 | 1.2 | 0.0 | 1.5 | 0.0 | 1.7 | 0.0 | 1.5 | 0.1 |
| Q50 | 0.8 | 0.0 | 0.8 | 0.0 | 1.3 | 0.1 | 1.6 | 0.0 | 1.4 | 0.1 | |
| subs. | trans. | pre-comm. | specd. comm. | divf. comm. | |||||||
|---|---|---|---|---|---|---|---|---|---|---|---|
| Variable | est. | std. err. | est. | std. err. | est. | std. err. | est. | std. err. | est. | std. err. | |
| aggross | Mean | 764.30 | 91.89 | 358.47 | 27.50 | 1,480.59 | 156.33 | 2,051.20 | 94.36 | 1,581.22 | 117.76 |
| Q50 | 322.59 | 32.34 | 21.10 | 16.61 | 906.75 | 50.29 | 1,446.06 | 80.14 | 1,036.63 | 79.69 | |
| totgross | Mean | 799.08 | 95.35 | 30,739.87 | 2,270.34 | 1,532.24 | 158.06 | 2,157.56 | 98.99 | 33,376.99 | 2,285.26 |
| Q50 | 330.23 | 32.57 | 8,175.35 | 705.53 | 934.65 | 47.01 | 1,511.40 | 88.77 | 11,445.19 | 985.85 | |
| (100 * naggross_sh) | Mean | 2.24 | 0.33 | 92.52 | 0.50 | 3.32 | 0.31 | 3.96 | 0.28 | 82.33 | 0.86 |
| Q50 | 0.00 | 0.00 | 99.83 | 0.12 | 0.00 | 0.00 | 0.00 | 0.00 | 91.57 | 1.15 | |
| cropvalue | Mean | 572.90 | 81.55 | 523.32 | 35.11 | 1,349.28 | 154.45 | 1,680.17 | 66.75 | 1,138.59 | 62.22 |
| Q50 | 265.33 | 26.33 | 261.90 | 22.65 | 813.72 | 53.96 | 1,187.46 | 62.01 | 773.29 | 65.30 | |
| cropsales | Mean | 5.02 | 2.21 | 99.55 | 8.72 | 341.55 | 22.78 | 1,273.75 | 54.35 | 870.28 | 51.81 |
| Q50 | 0.00 | 0.00 | 0.00 | 0.00 | 200.00 | 16.58 | 880.00 | 53.12 | 521.02 | 58.67 | |
| (100 * cropsales_sh) | Mean | 0.30 | 0.05 | 7.70 | 0.65 | 29.57 | 0.59 | 76.60 | 0.72 | 78.63 | 0.74 |
| Q50 | 0.00 | 0.00 | 0.00 | 0.00 | 30.40 | 1.01 | 76.94 | 1.25 | 79.55 | 1.20 | |
| totlvstprod | Mean | 14.64 | 2.84 | 29.71 | 2.81 | 77.76 | 5.66 | 300.83 | 74.86 | 395.16 | 97.55 |
| Q50 | 0.00 | 0.00 | 0.00 | 0.00 | 16.16 | 4.34 | 3.70 | 4.08 | 5.00 | 4.28 | |
| totlivsold | Mean | 1.86 | 0.64 | 19.79 | 2.09 | 60.00 | 4.86 | 287.82 | 74.08 | 383.90 | 97.10 |
| Q50 | 0.00 | 0.00 | 0.00 | 0.00 | 0.00 | 0.00 | 0.00 | 0.00 | 0.00 | 0.00 | |
| subs. | trans. | pre-comm. | specd. comm. | divf. comm. | |||||||
|---|---|---|---|---|---|---|---|---|---|---|---|
| Variable | est. | std. err. | est. | std. err. | est. | std. err. | est. | std. err. | est. | std. err. | |
| (1000 * TLU_horse) | Mean | 5 | 2 | 1 | 0 | 3 | 1 | 2 | 1 | 2 | 0 |
| Q50 | 0 | 0 | 0 | 0 | 0 | 0 | 0 | 0 | 0 | 0 | |
| (1000 * TLU_cattle) | Mean | 21 | 4 | 14 | 3 | 24 | 4 | 26 | 4 | 19 | 4 |
| Q50 | 0 | 0 | 0 | 0 | 0 | 0 | 0 | 0 | 0 | 0 | |
| (1000 * TLU_pigs) | Mean | 9 | 2 | 4 | 1 | 8 | 1 | 6 | 1 | 4 | 1 |
| Q50 | 0 | 0 | 0 | 0 | 0 | 0 | 0 | 0 | 0 | 0 | |
| (1000 * TLU_sheep) | Mean | 24 | 3 | 22 | 1 | 36 | 2 | 34 | 2 | 35 | 2 |
| Q50 | 0 | 0 | 0 | 0 | 0 | 3 | 0 | 0 | 0 | 0 | |
| (1000 * TLU_small) | Mean | 8 | 1 | 7 | 0 | 12 | 1 | 11 | 1 | 10 | 1 |
| Q50 | 0 | 1 | 0 | 0 | 7 | 1 | 4 | 1 | 4 | 1 | |
| (1000 * TLU_total) | Mean | 67 | 9 | 49 | 4 | 83 | 6 | 79 | 6 | 69 | 6 |
| Q50 | 4 | 3 | 2 | 1 | 27 | 3 | 19 | 3 | 22 | 3 | |
| subs. | trans. | pre-comm. | specd. comm. | divf. comm. | |||||||
|---|---|---|---|---|---|---|---|---|---|---|---|
| Variable | est. | std. err. | est. | std. err. | est. | std. err. | est. | std. err. | est. | std. err. | |
| (100 * seeds) | Mean | 9 | 1 | 15 | 1 | 18 | 2 | 16 | 2 | 19 | 2 |
| Q50 | 0 | 0 | 0 | 0 | 0 | 0 | 0 | 0 | 0 | 0 | |
| (100 * fert_any) | Mean | 35 | 3 | 29 | 2 | 46 | 2 | 45 | 2 | 39 | 2 |
| Q50 | 0 | 0 | 0 | 0 | 0 | 26 | 0 | 0 | 0 | 0 | |
| (100 * fert_inorg) | Mean | 29 | 3 | 20 | 1 | 36 | 3 | 35 | 2 | 25 | 2 |
| Q50 | 0 | 0 | 0 | 0 | 0 | 0 | 0 | 0 | 0 | 0 | |
| (100 * fert_org) | Mean | 8 | 2 | 10 | 1 | 12 | 1 | 12 | 1 | 15 | 2 |
| Q50 | 0 | 0 | 0 | 0 | 0 | 0 | 0 | 0 | 0 | 0 | |
| (100 * herb) | Mean | 31 | 3 | 47 | 2 | 63 | 3 | 65 | 2 | 60 | 3 |
| Q50 | 0 | 0 | 0 | 26 | 100 | 0 | 100 | 0 | 100 | 0 | |
| (100 * pest) | Mean | 15 | 2 | 22 | 1 | 26 | 2 | 38 | 2 | 37 | 3 |
| Q50 | 0 | 0 | 0 | 0 | 0 | 0 | 0 | 0 | 0 | 0 | |
| (100 * irr) | Mean | 0 | 0 | 1 | 0 | 0 | 0 | 1 | 0 | 1 | 0 |
| Q50 | 0 | 0 | 0 | 0 | 0 | 0 | 0 | 0 | 0 | 0 | |
| (100 * fuel) | Mean | 16 | 2 | 24 | 1 | 28 | 2 | 35 | 2 | 29 | 2 |
| Q50 | 0 | 0 | 0 | 0 | 0 | 0 | 0 | 0 | 0 | 0 | |
| (100 * hired_labor) | Mean | 30 | 3 | 43 | 2 | 44 | 2 | 49 | 2 | 51 | 2 |
| Q50 | 0 | 0 | 0 | 0 | 0 | 0 | 0 | 26 | 100 | 0 | |
Below are estimated distributions of key characteristics for farms below 4 ha as of 2012/13.

Fig. 3.37: Est. Farm Size and Cultivated Area of Farm Holdings below 4 ha across Farm Types (2012/13, ha)

Fig. 3.38: Est. Gross Farm Income and Crop Sales for Farm Holdings below 4 ha across Farm Types (2012/13, ’000 Cedis)

Fig. 3.39: Est. Input Uses for Farm Holdings below 4 ha across Farm Types (2012/13, percent of farms)

Fig. 3.39: Est. Input Uses for Farm Holdings below 4 ha across Farm Types (2012/13, percent of farms)
4.2.6 Revised Development Domains
In this section we combine results from the farm typology developed in Section 3 with the spatial dimensions outlined above (agricultural suitability and market access using GLUES suitability product and IFPRI/HarvestChoice travel time to nearest 100K market). GLUES suitability grid was modified to account for unsuitable forested, protected, and urban areas (white pixels).
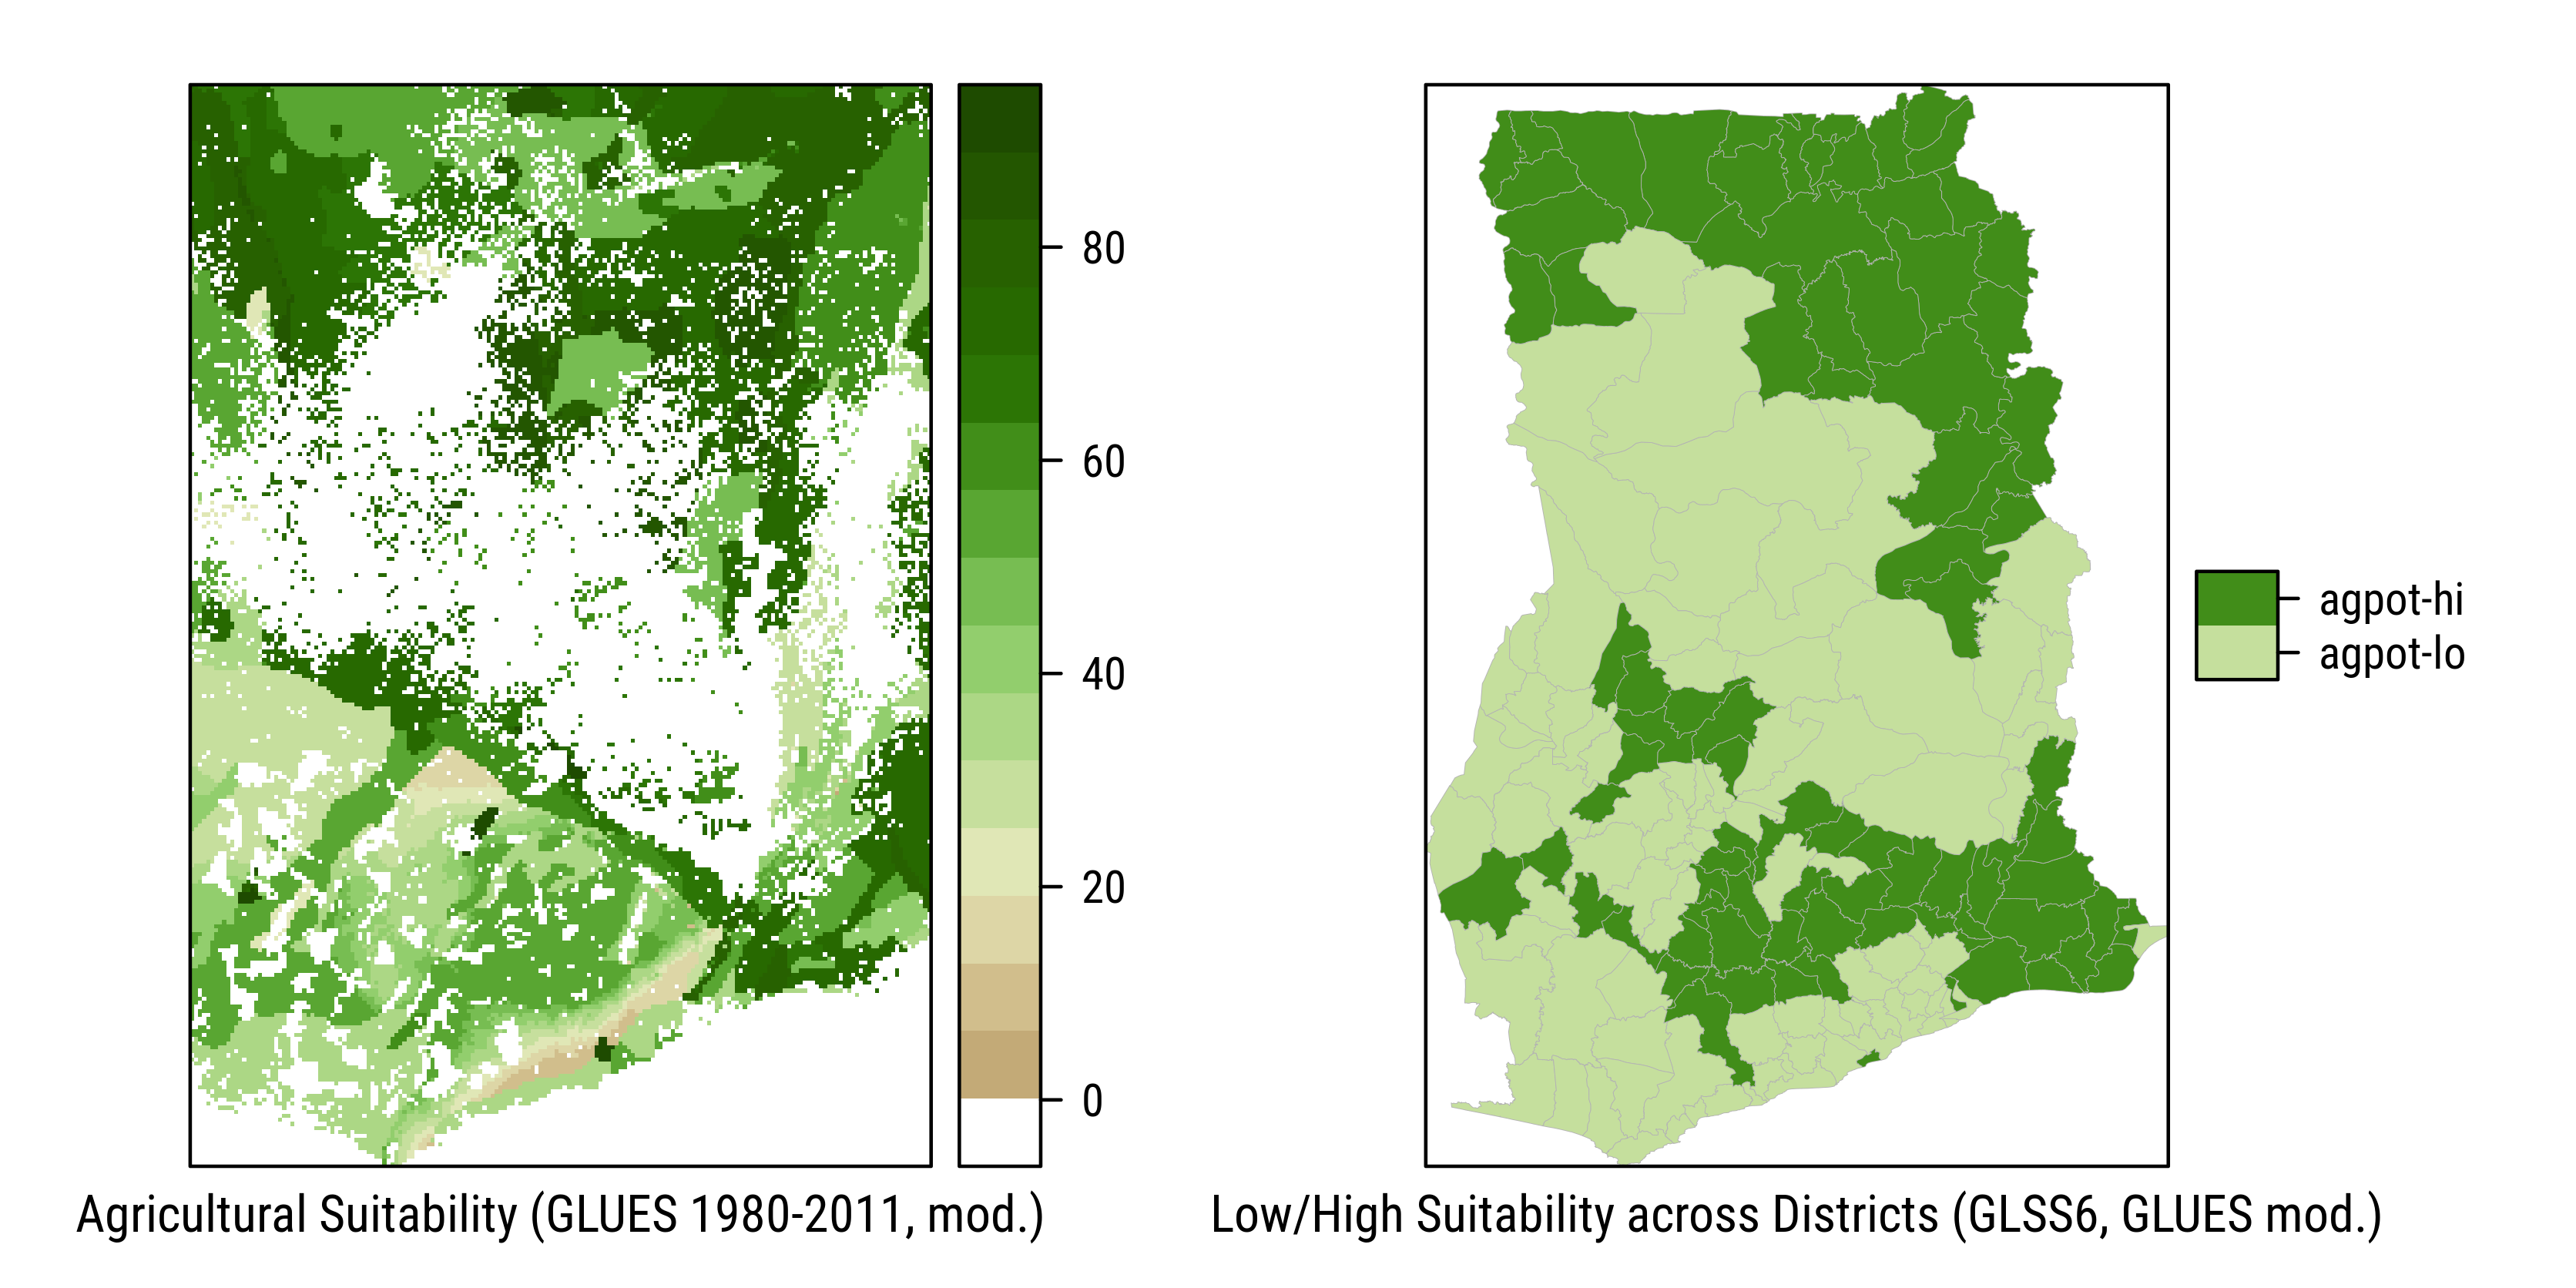
Fig. 3.40: Areas of Low/High Agricultural Suitability (Ghana, 1980-2011)
The 2 maps below show Ghana’s districts (GLSS6) classified across areas of lo/hi ag. potential and lo/hi market access (using below/above 4hrs travel time to nearest 100K market).
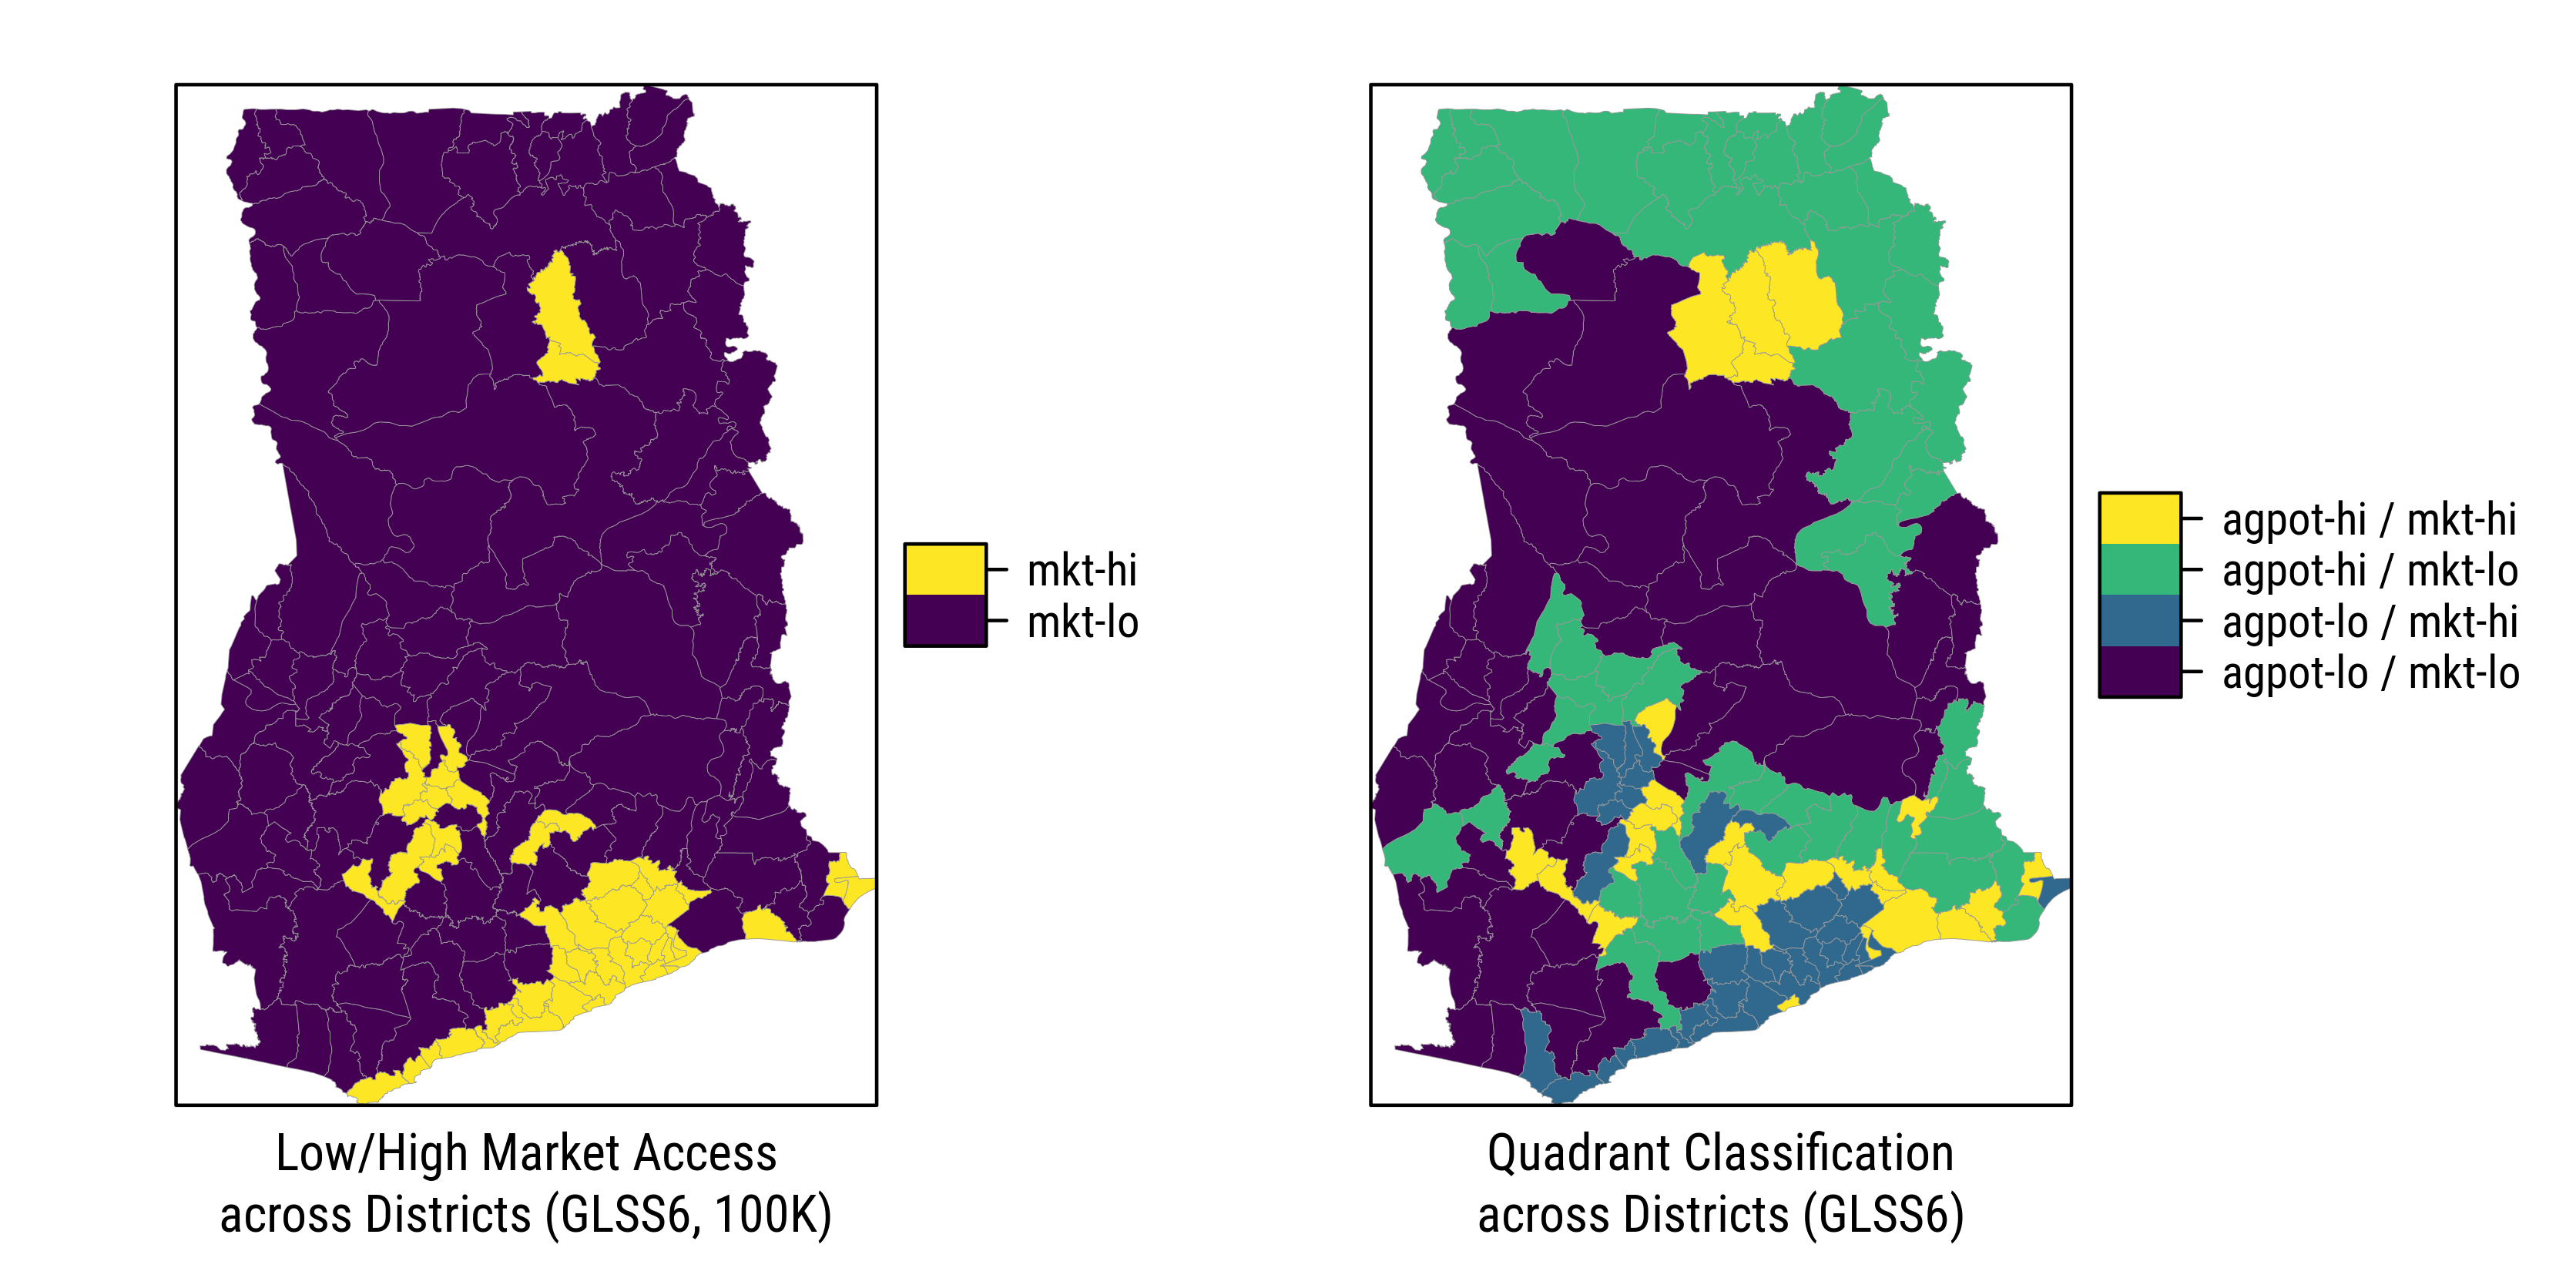
Fig. 3.41: Spatial Quadrant Segmentation
First we show the distribution of small/large farms across the revised quadrant typology.

Fig. 3.42: Est. Proportions of Farm Holdings across Quadrants (below/above 4 ha)
| Market Access | |||
|---|---|---|---|
| Ag. Potential | mkt-hi | mkt-lo | |
| agpot-hi | mean | 9.1 | 44.8 |
| CI | 6.4 - 11.7 | 40.7 - 48.8 | |
| agpot-lo | mean | 16.8 | 29.4 |
| CI | 13.5 - 20.1 | 25.9 - 32.8 | |
Below we show the distribution of small holdings across quadrants and farm types.

Fig. 3.43: Est. Proportions of Farm Holdings across Farm Types and Quadrants (farms below 4 ha, GLUES crop suitability)
| Farm Type | ||||||
|---|---|---|---|---|---|---|
| Development Domain (GLUES) | subs. | trans. | pre-comm. | specd. comm. | divf. comm. | |
| agpot-lo / mkt-lo | mean | 1.7 | 8.4 | 3.4 | 7.6 | 4.8 |
| CI | 1.2 - 2.3 | 6.8 - 10.0 | 2.6 - 4.2 | 6.2 - 9.0 | 3.8 - 5.9 | |
| agpot-lo / mkt-hi | mean | 1.1 | 10.1 | 2.0 | 3.5 | 3.9 |
| CI | 0.5 - 1.6 | 8.0 - 12.2 | 1.1 - 2.9 | 2.4 - 4.6 | 2.7 - 5.1 | |
| agpot-hi / mkt-lo | mean | 4.5 | 13.6 | 7.0 | 8.8 | 4.9 |
| CI | 3.6 - 5.4 | 11.4 - 15.9 | 5.7 - 8.3 | 7.0 - 10.5 | 3.6 - 6.1 | |
| agpot-hi / mkt-hi | mean | 0.8 | 6.8 | 2.1 | 2.7 | 2.3 |
| CI | 0.5 - 1.1 | 5.1 - 8.5 | 1.3 - 2.9 | 1.9 - 3.5 | 1.5 - 3.0 | |