3.1 Nigeria
Relevant sources of household-level micro records for Nigeria include:
- 2010 and 2012 Nigeria General Household Survey Panels
- 2003 and 2009/10 Harmonized Nigeria Living Standard Surveys
- DfID’s sponsored agricultural survey (1,300 hhlds) (contact Abt Associates)
- Fadama III 2009 Baseline and 2012 Midline Surveys and Fadama’s Agricultural Production Surveys (APS) (still not publicly available, see e.g. Girei, Saingbe, Bitrus, & Bassey (2017))
- 2010/11 National Agricultural Sample Survey (NASS) (only a PDF is available)
- 2006 Nigeria Private Farmer Crop Sample Survey
- 2006 Nigeria Private Farmer Livestock Poultry Sample Survey
Note that all intermediary value variables (income and expenses) have been generated by IFPRI using FAO RIGA guidelines.
Using these variables we define a farm holding as a household matching any of the following conditions:
- has any \(farmarea\) or \(croparea\)
- has any \(cropvalue\) or \(lstocksold\) or \(fishsold\)
- owns any livestock \(TLU\_total\)
- collects any other revenue from farming \(aggross\)
Within the sub-sample of farm households we look at the distribution of households across 3 key (“threshold”) variables:
- Cultivated/operated area \(croparea\) (using breaks at 2 ha and/or 4 ha and excluding farm households with no \(croparea\))
- Crop commercialization \(cropsales\_sh\) (using breaks at 5% and 50% of crop production)
- Share of off-farm income in total hhld income \(naggross\_sh\) (using breaks at 1/3 and 2/3 of total gross income)
The resulting classes of farm households are labeled as follows:
| Crop Commercialization | |||
|---|---|---|---|
| Income Diversification | low | medium | high |
| low | LoCLoD | MeCLoD | HiCLoD |
| medium | LoCMeD | MeCMeD | HiCMeD |
| high | LoCHiD | MeCHiD | HiCHiD |
3.1.1 An Aside on Income Diversification
Initial results from the 2 Nigeria GHS panels tend to show very low income diversification among rural farm households. We propose to check these results against income and expenditure aggregates derived by FAO RIGA. RIGA documentation for Nigeria indicates the following aggregate income shares (FAO, 2016) (among rural households only):
| Variable | Participants | Participation Rate | Returns to Participation - Participant HHs | Returns to Participation - All HHs | Share of Total Income - All HHs (Mean of Shares) | Share ofTotal Income - All HHs (Share of Means) |
|---|---|---|---|---|---|---|
| agr_wge | 40 | 0.01 | 311,337 | 3,515 | 0.01 | 0.01 |
| nonagr_wge | 446 | 0.14 | 731,050 | 104,061 | 0.12 | 0.24 |
| crop1 | 2,490 | 0.75 | 292,214 | 217,792 | 0.71 | 0.51 |
| livestock | 2,538 | 0.76 | 34,194 | 25,848 | 0.05 | 0.06 |
| selfemp | 1,851 | 0.59 | 121,179 | 71,630 | 0.09 | 0.17 |
| transfer | 138 | 0.05 | 9,069 | 408 | 0.00 | 0.00 |
| other | 462 | 0.15 | 42,125 | 6,240 | 0.02 | 0.01 |
| totincome1 | 3,099 | 0.95 | 450,431 | 429,495 | 1.00 | 1.00 |
All income aggregates are net of expenses. For this study however gross crop and livestock sales and gross farm and non-farm incomes would be preferable. These are derived in the codes below [in progress].
3.1.2 Key Results
The following 3 tables show the count of observations in each class for farm households with cultivated area <= 2ha, between 2 and 4ha, and <= 4ha.
| \(\leq\) 2 ha | 2-4 ha | \(>\) 4 ha | ||||||||
|---|---|---|---|---|---|---|---|---|---|---|
| LoC | MeC | HiC | LoC | MeC | HiC | LoC | MeC | HiC | All | |
| LoD | 1,740 | 92 | 92 | 182 | 8 | 14 | 75 | 4 | 3 | 2528 |
| MeD | 26 | 25 | 51 | 0 | 1 | 2 | 0 | 1 | 2 | 172 |
| HiD | 126 | 72 | 85 | 5 | 1 | 4 | 0 | 0 | 6 | 608 |
| All | 1,892 | 189 | 228 | 187 | 10 | 20 | 75 | 5 | 11 | 4880 |
| \(\leq\) 2 ha | \(>\) 2 ha | ||||||
|---|---|---|---|---|---|---|---|
| LoC | MeC | HiC | LoC | MeC | HiC | All | |
| LoD | 1,740 | 92 | 92 | 257 | 12 | 17 | 2528 |
| MeD | 26 | 25 | 51 | 0 | 2 | 4 | 172 |
| HiD | 126 | 72 | 85 | 5 | 1 | 10 | 608 |
| All | 1,892 | 189 | 228 | 262 | 15 | 31 | 4880 |
| \(\leq\) 4 ha | \(>\) 4 ha | ||||||
|---|---|---|---|---|---|---|---|
| LoC | MeC | HiC | LoC | MeC | HiC | All | |
| LoD | 2,011 | 117 | 121 | 75 | 4 | 3 | 2528 |
| MeD | 39 | 33 | 67 | 0 | 1 | 2 | 172 |
| HiD | 169 | 82 | 102 | 0 | 0 | 6 | 608 |
| All | 2,219 | 232 | 290 | 75 | 5 | 11 | 4880 |
In the next tables we limit categories to farm households below/above 4ha (as this approach produces classes with a larger count of observations). Using data from the 2012 Nigeria General Household Survey (GHS) we estimate the proportions of farm households across all categories and the distributions of other key household characteristics (household structure, assets, farm input uses, etc.).
Estimated proportions of farm households across classes and categories are shown in the next graph and table.

Fig. 3.1: Est. Proportions of Farm Holdings across Categories
| \(\leq\) 4 ha | \(>\) 4 ha | ||||||
|---|---|---|---|---|---|---|---|
| LoC | MeC | HiC | LoC | MeC | HiC | ||
| LoD | mean | 70.7 | 4.0 | 4.6 | 2.0 | 0.3 | 0.1 |
| confint | 67.4 - 73.9 | 3.1 - 5.0 | 3.4 - 5.8 | 1.3 - 2.7 | 0.0 - 0.6 | 0.0 - 0.2 | |
| MeD | mean | 1.1 | 1.2 | 2.6 | 0.0 | 0.0 | 0.2 |
| confint | 0.7 - 1.6 | 0.7 - 1.6 | 1.8 - 3.3 | 0.0 - 0.0 | 0.0 - 0.1 | 0.0 - 0.5 | |
| HiD | mean | 5.9 | 3.0 | 4.1 | 0.0 | 0.0 | 0.2 |
| confint | 4.6 - 7.2 | 2.2 - 3.8 | 3.0 - 5.3 | 0.0 - 0.0 | 0.0 - 0.0 | 0.0 - 0.4 | |
Using the <= 4 ha smallholding definition above, we estimate as of 2012:
- there are 33M households in Nigeria
- 58.8% (19.2M) generate a revenue from farming (wages, rents, crops, livestock, and/or fish)
- 97% (16M) of farm holdings are small
- corresponding to a beneficiary population of 107M
- crop commercialization is low at 12.2% for smallholdings (below 4 ha) and 17.7% for larger holdings (over 4 ha) on average. Median rates are much smaller however with 0.07% for smallholdings and 0.30% for larger holdings.
- income diversification in farm households is 17% on average (18% for smallholdings and 13% for larger holdings) (i.e. off-farm income is 17% on average), but medians off-farm incomes are negligible at 0.83% (0.63% for smallholdings and 0.33% for larger holdings).
Notes: for LCU conversions 1 int$ = 108.23 Naira (2015)

Fig. 3.2: Prob. Density of Cultivated Area, Crop Commercialization, and Income Diversification

Fig. 3.3: Crop Commercialization and Income Diversification along Cultivated Area
| \(\leq\) 4 ha | \(>\) 4 ha | ||||
|---|---|---|---|---|---|
| Variable | est. | std. err. | est. | std. err. | |
| (cropsales_sh * 100) | Mean | 12.20 | 0.99 | 17.68 | 4.56 |
| Q25 | 0.00 | 0.00 | 0.06 | 0.02 | |
| Q50 | 0.08 | 0.02 | 0.30 | 0.50 | |
| Q75 | 1.15 | 0.38 | 7.90 | 23.01 | |
| (cropsales/1000) | Mean | 63.74 | 5.44 | 195.50 | 49.81 |
| Q25 | 0.00 | 0.00 | 21.08 | 10.55 | |
| Q50 | 8.00 | 1.71 | 62.03 | 21.80 | |
| Q75 | 54.35 | 6.49 | 193.38 | 113.64 | |
| \(\leq\) 4 ha | \(>\) 4 ha | ||||
|---|---|---|---|---|---|
| Variable | est. | std. err. | est. | std. err. | |
| (noaggross_sh * 100) | Mean | 17.59 | 1.19 | 12.54 | 3.29 |
| Q25 | 0.00 | 0.00 | 0.00 | 0.02 | |
| Q50 | 0.63 | 0.09 | 0.33 | 0.12 | |
| Q75 | 8.07 | 3.44 | 2.14 | 9.73 | |
| (noaggross/1000) | Mean | 293.92 | 16.17 | 309.64 | 61.23 |
| Q25 | 0.00 | 0.00 | 0.00 | 5.15 | |
| Q50 | 113.48 | 9.70 | 132.73 | 53.38 | |
| Q75 | 363.10 | 19.87 | 393.34 | 82.47 | |
The 9 categories of small farm holdings are further characterized in the following graphs and summary tables.
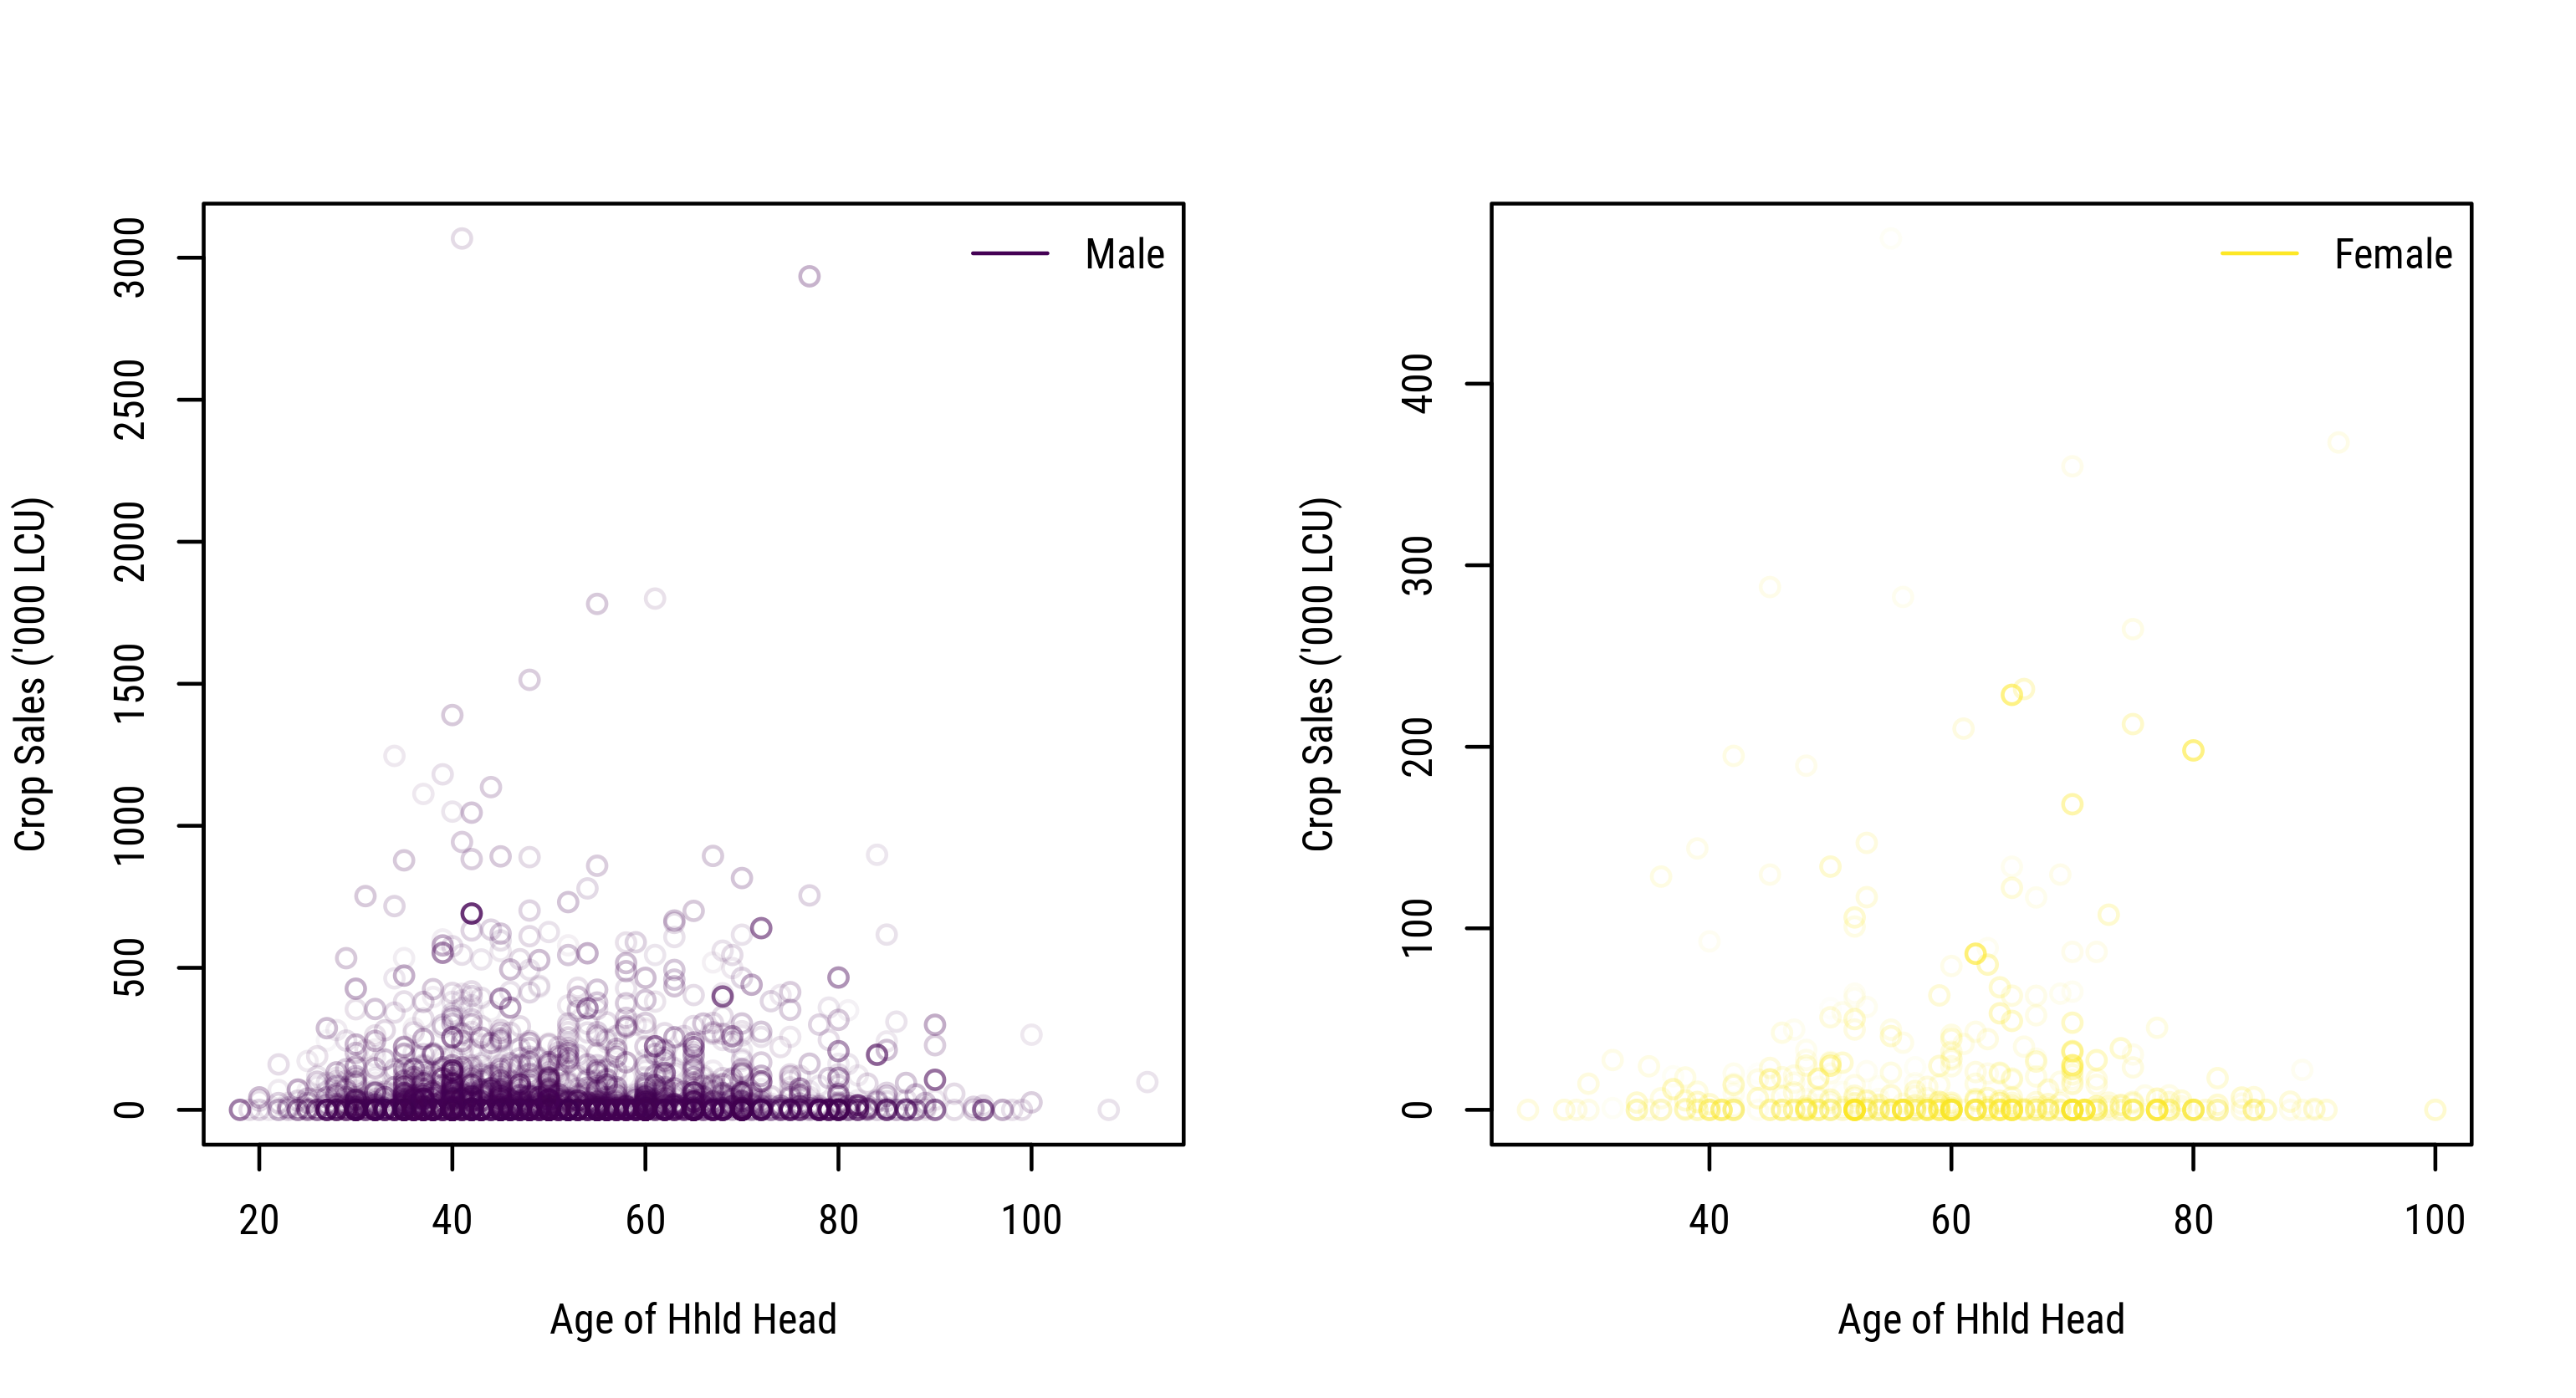
Fig. 3.4: Crop Commercialization by Age and Gender
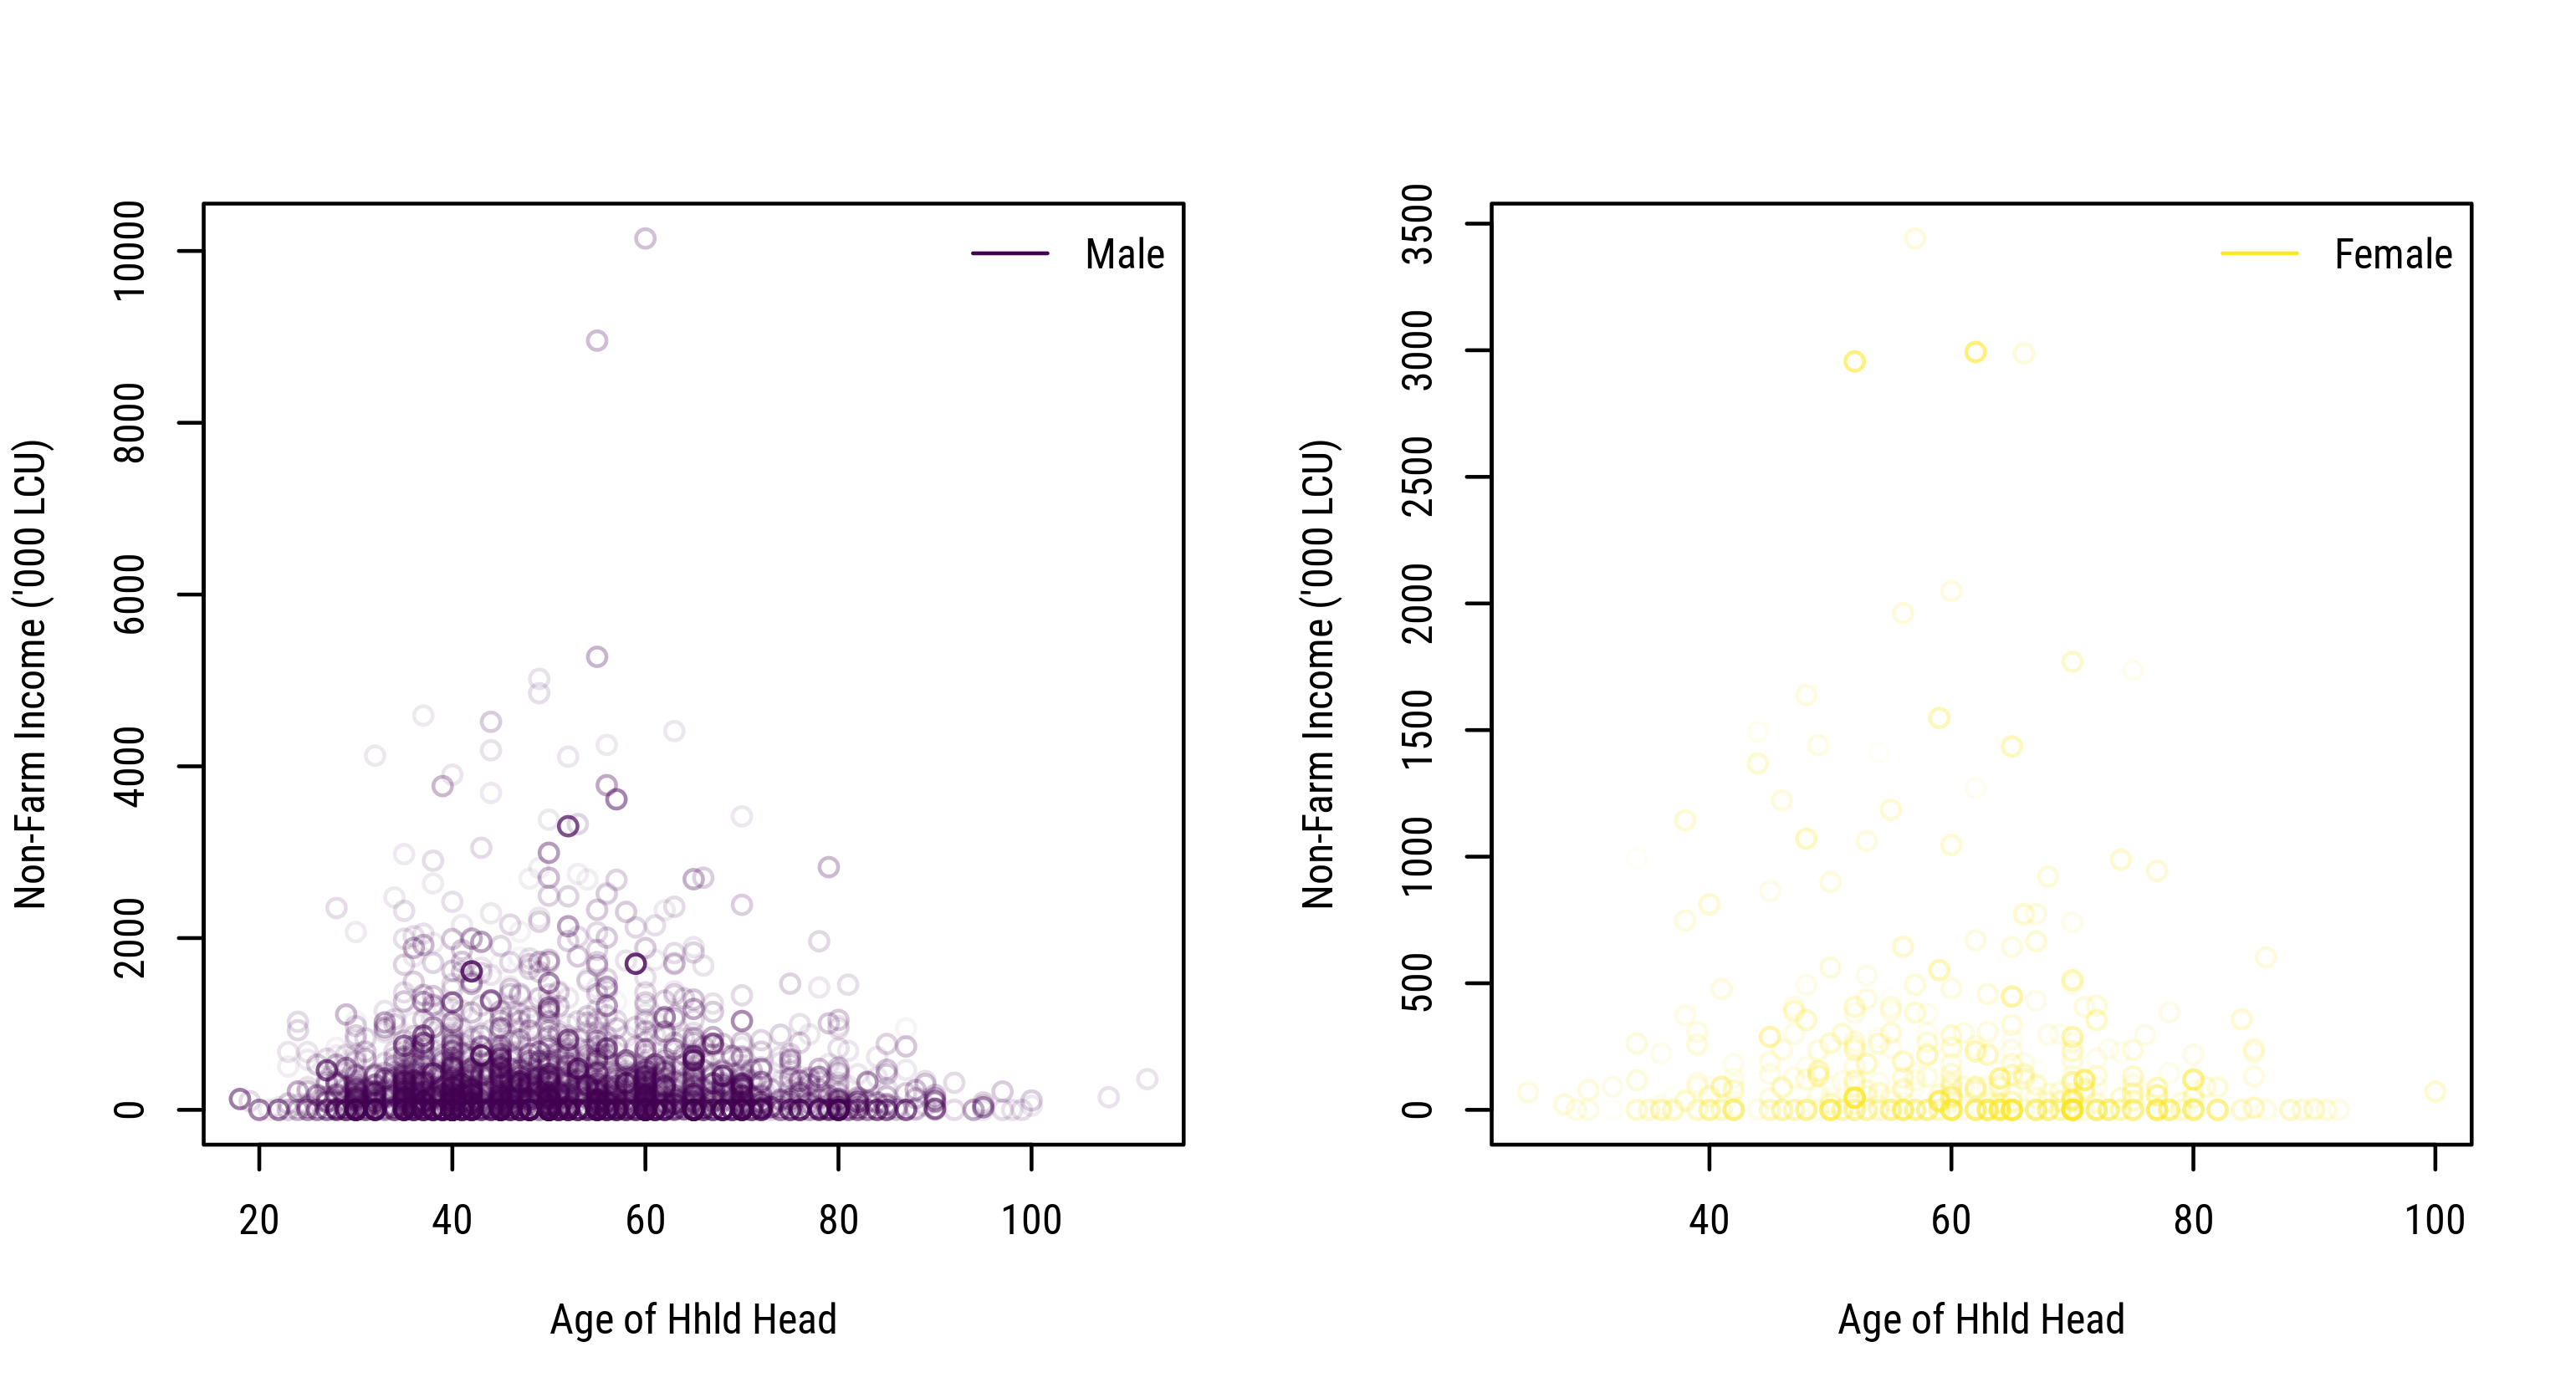
Fig. 3.5: Income Diversification by Age and Gender
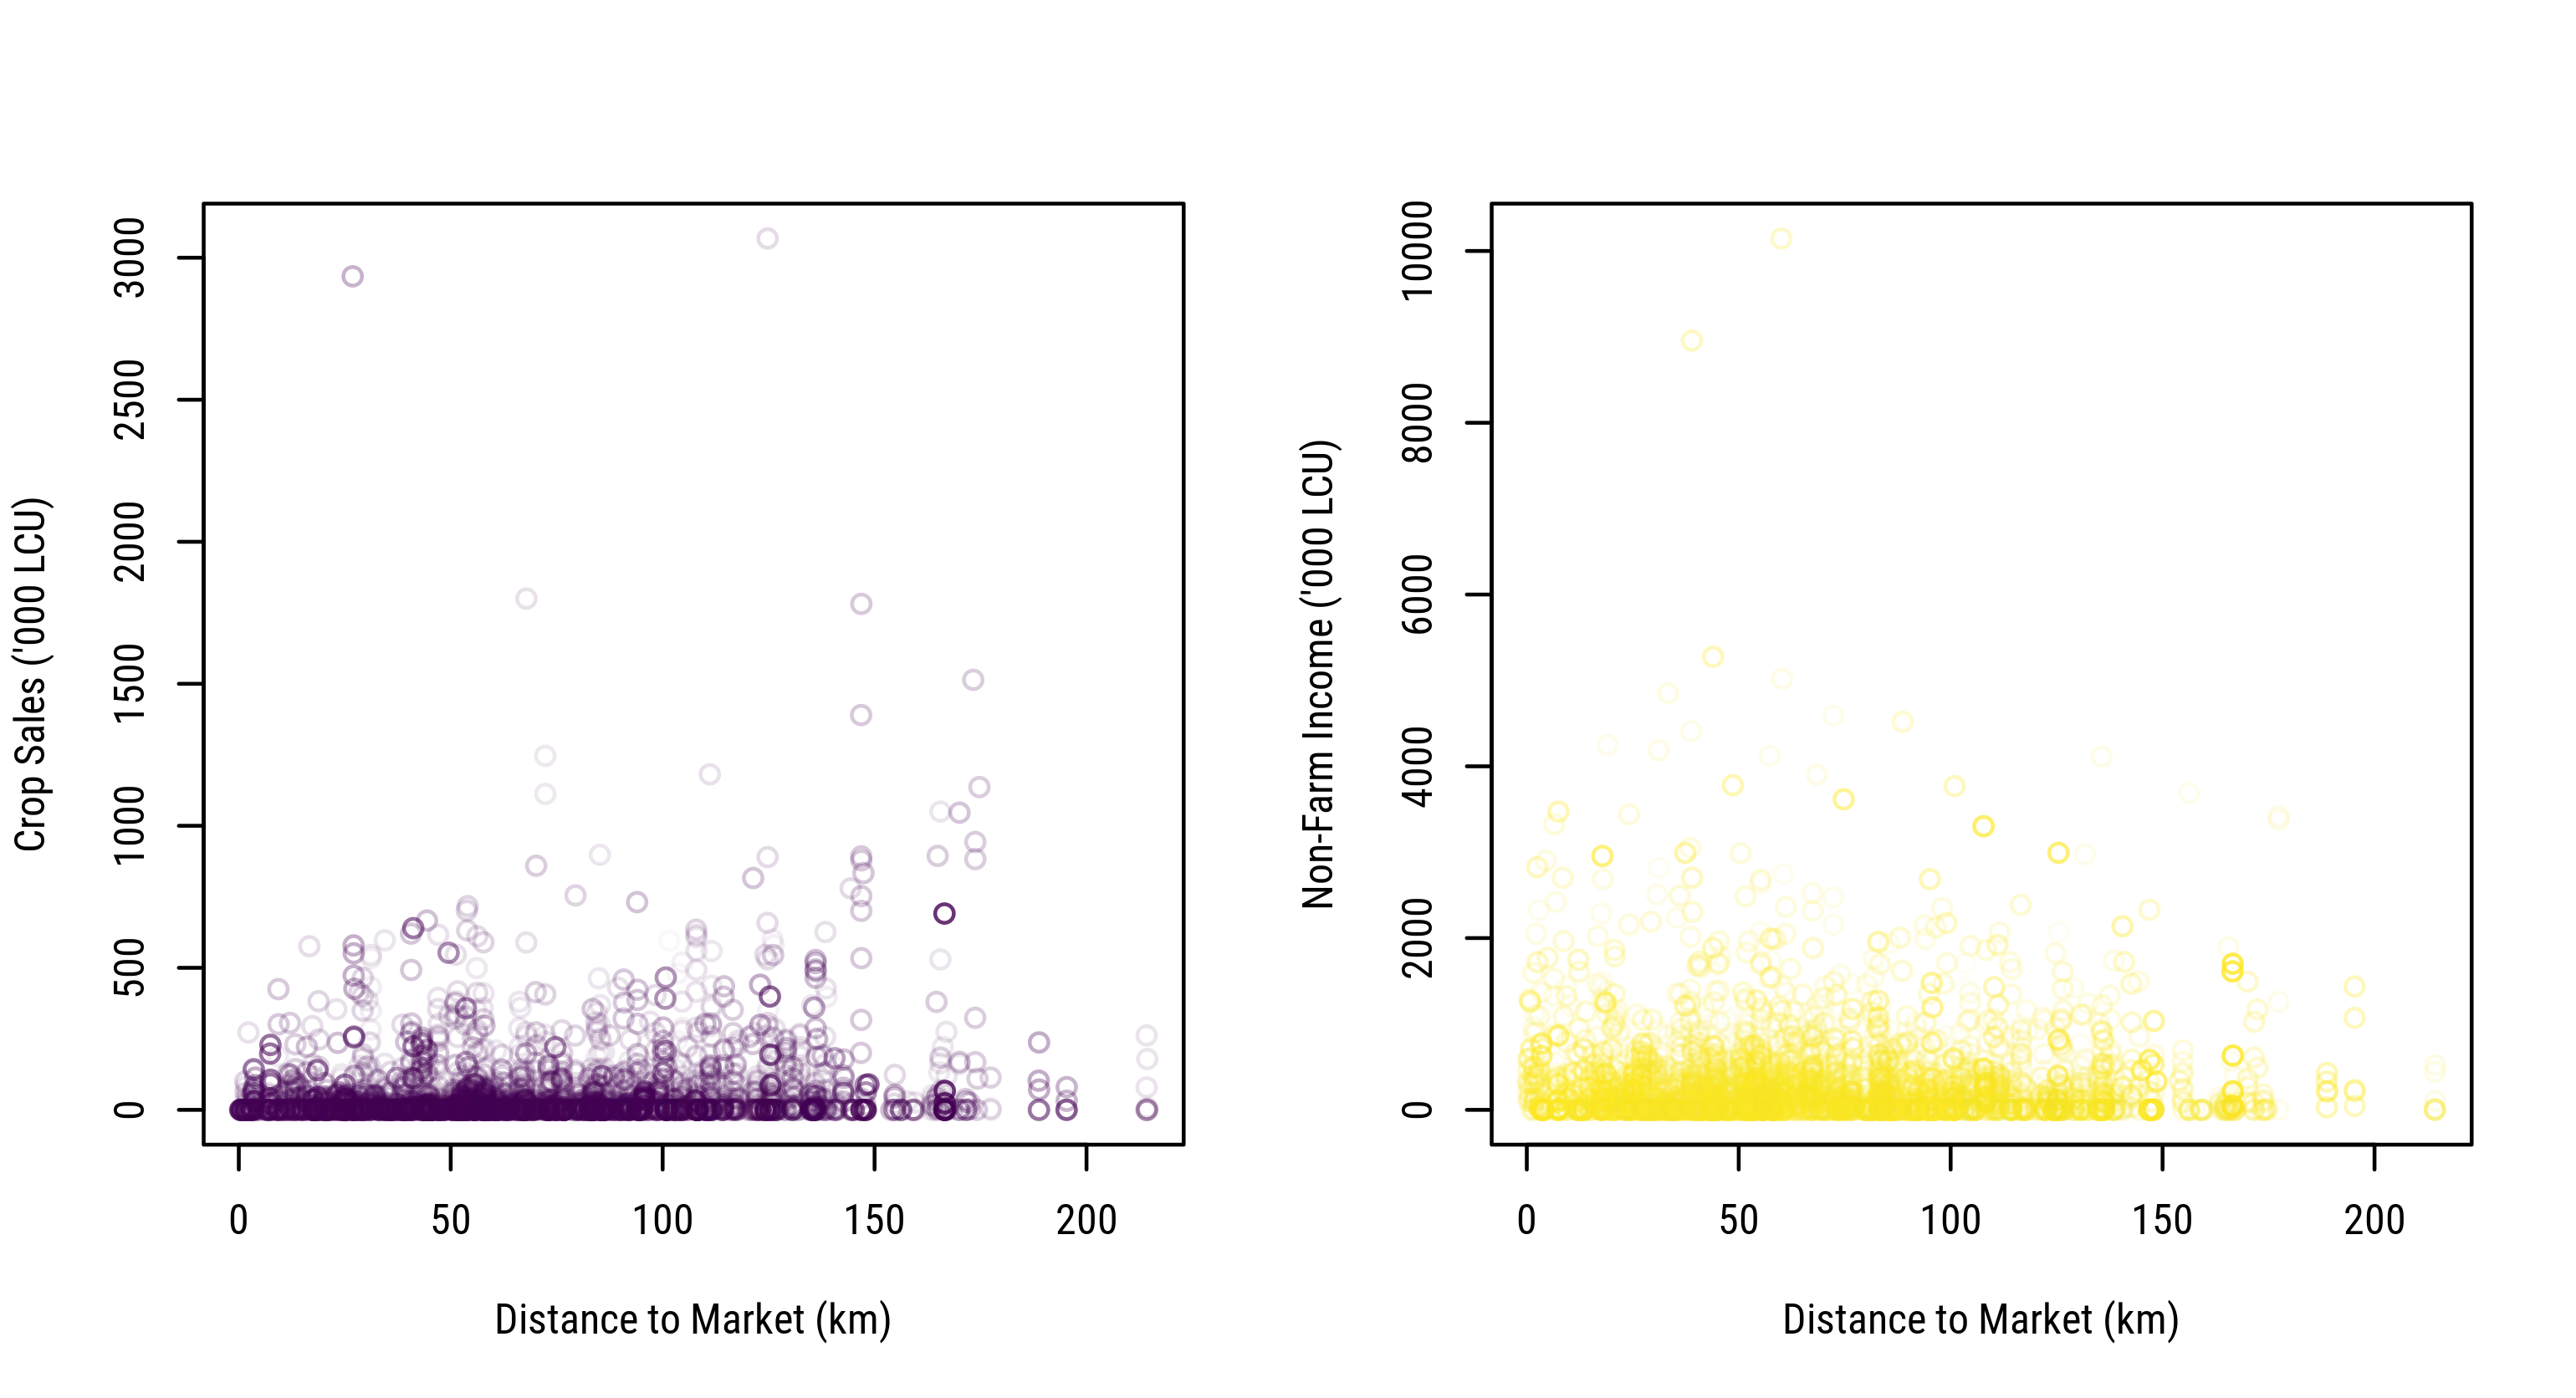
Fig. 3.6: Crop Commercialization and Income Diversification along Market Access
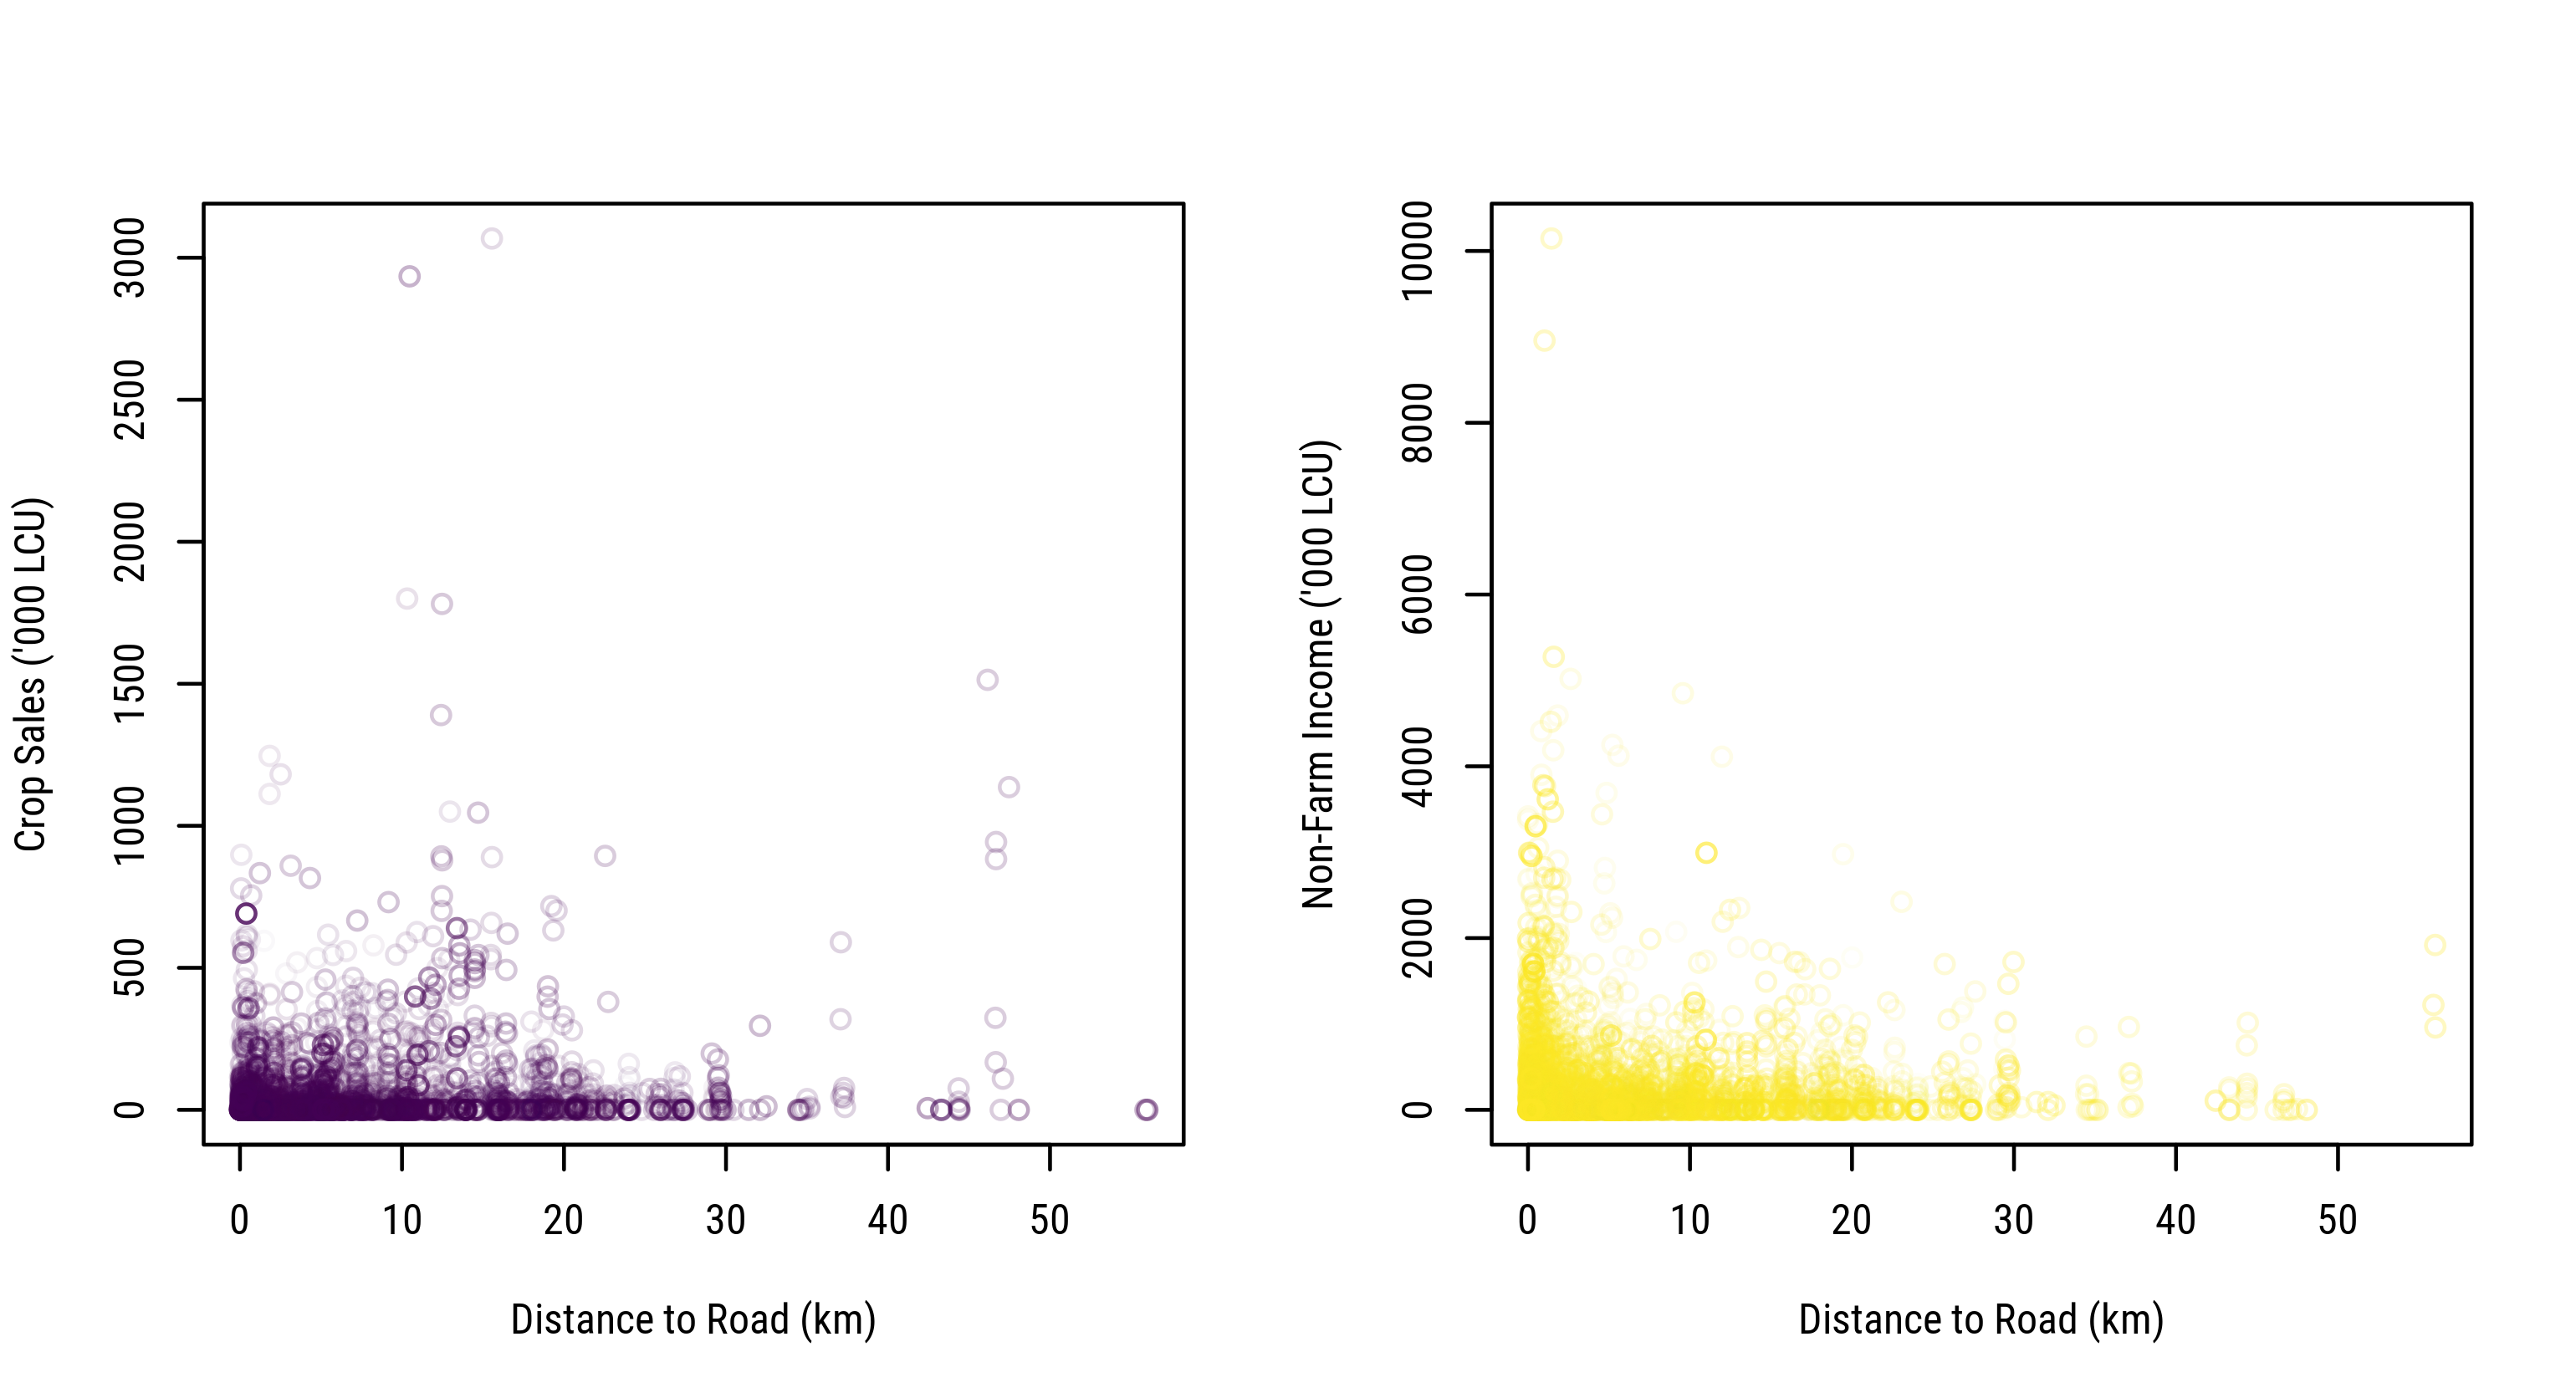
Fig. 3.7: Crop Commercialization and Income Diversification vs. Distance to Nearest Road
Note that all tables below omit standard errors for clarity.
| LoCLoD | LoCMeD | LoCHiD | MeCLoD | MeCMeD | MeCHiD | HiCLoD | HiCMeD | HiCHiD | ||
|---|---|---|---|---|---|---|---|---|---|---|
| Variable | est. | est. | est. | est. | est. | est. | est. | est. | est. | |
| dist_market | Mean | 66.72 | 81.09 | 64.74 | 86.28 | 75.66 | 61.76 | 75.61 | 76.95 | 66.44 |
| Q50 | 58.16 | 69.39 | 59.24 | 90.40 | 71.85 | 57.23 | 70.09 | 68.50 | 53.94 | |
| dist_road2 | Mean | 7.61 | 4.68 | 3.86 | 7.75 | 4.97 | 3.58 | 7.80 | 7.92 | 5.08 |
| Q50 | 4.98 | 3.01 | 1.37 | 5.45 | 2.88 | 1.41 | 6.09 | 5.83 | 1.07 | |
| mkt50k | Mean | 3.27 | 2.37 | 2.42 | 3.92 | 2.90 | 2.86 | 4.08 | 3.54 | 2.97 |
| Q50 | 2.91 | 2.27 | 1.76 | 3.18 | 2.51 | 1.86 | 3.23 | 2.80 | 2.29 | |
| mkt100k | Mean | 3.47 | 2.48 | 2.58 | 4.26 | 3.17 | 3.00 | 5.05 | 3.84 | 3.41 |
| Q50 | 2.96 | 2.25 | 2.00 | 3.24 | 2.63 | 2.07 | 3.40 | 2.97 | 2.45 |
| LoCLoD | LoCMeD | LoCHiD | MeCLoD | MeCMeD | MeCHiD | HiCLoD | HiCMeD | HiCHiD | ||
|---|---|---|---|---|---|---|---|---|---|---|
| Variable | est. | est. | est. | est. | est. | est. | est. | est. | est. | |
| (cropvalue/1000) | Mean | 32,136 | 73 | 33 | 2,768 | 125 | 49 | 246 | 242 | 59 |
| Q50 | 26,043 | 36 | 24 | 128 | 113 | 34 | 146 | 172 | 36 | |
| (cropsales/1000) | Mean | 49 | 0 | 0 | 263 | 40 | 12 | 216 | 220 | 49 |
| Q50 | 7 | 0 | 0 | 38 | 26 | 7 | 117 | 159 | 29 | |
| (lstocksold/1000) | Mean | 225 | 81 | 8 | 335 | 132 | 13 | 595 | 106 | 15 |
| Q50 | 0 | 0 | 0 | 0 | 0 | 0 | 0 | 0 | 0 | |
| (agsales/1000) | Mean | 357 | 81 | 9 | 605 | 174 | 25 | 934 | 326 | 64 |
| Q50 | 36 | 0 | 0 | 84 | 50 | 11 | 249 | 211 | 44 | |
| agsalespc | Mean | 82,419 | 14,910 | 1,858 | 185,677 | 35,520 | 6,667 | 270,919 | 107,205 | 18,699 |
| Q50 | 8,008 | 0 | 0 | 19,051 | 10,462 | 2,586 | 58,272 | 65,284 | 9,448 | |
| (aggross/1000) | Mean | 32,448 | 186 | 44 | 3,131 | 264 | 64 | 970 | 400 | 78 |
| Q50 | 26,207 | 75 | 32 | 239 | 135 | 44 | 295 | 307 | 47 | |
| (cropsales_sh * 100) | Mean | 0 | 0 | 0 | 21 | 29 | 24 | 87 | 88 | 84 |
| Q50 | 0 | 0 | 0 | 18 | 31 | 22 | 91 | 94 | 93 | |
| (aggross_sh * 100) | Mean | 99 | 46 | 10 | 97 | 50 | 14 | 93 | 48 | 15 |
| Q50 | 100 | 45 | 7 | 100 | 47 | 12 | 100 | 47 | 15 |
| LoCLoD | LoCMeD | LoCHiD | MeCLoD | MeCMeD | MeCHiD | HiCLoD | HiCMeD | HiCHiD | ||
|---|---|---|---|---|---|---|---|---|---|---|
| Variable | est. | est. | est. | est. | est. | est. | est. | est. | est. | |
| farmarea | Mean | 0.72 | 0.23 | 0.23 | 0.88 | 0.44 | 0.24 | 0.78 | 0.52 | 0.48 |
| Q50 | 0.46 | 0.10 | 0.07 | 0.55 | 0.21 | 0.10 | 0.43 | 0.35 | 0.35 | |
| croparea | Mean | 0.71 | 0.23 | 0.23 | 0.88 | 0.43 | 0.24 | 0.78 | 0.52 | 0.48 |
| Q50 | 0.45 | 0.10 | 0.07 | 0.55 | 0.17 | 0.10 | 0.43 | 0.35 | 0.33 | |
| catt_numberimp | Mean | 1.56 | 0.12 | 0.14 | 0.13 | 0.75 | 0.27 | 0.87 | 0.17 | 0.23 |
| Q50 | 0.00 | 0.00 | 0.00 | 0.00 | 0.00 | 0.00 | 0.00 | 0.00 | 0.00 | |
| pigs_numberimp | Mean | 0.18 | 0.07 | 0.02 | 0.02 | 0.00 | 0.70 | 0.00 | 0.00 | 0.49 |
| Q50 | 0.00 | 0.00 | 0.00 | 0.00 | 0.00 | 0.00 | 0.00 | 0.00 | 0.00 | |
| chic_numberimp | Mean | 7.76 | 5.86 | 5.49 | 5.52 | 4.23 | 4.11 | 4.22 | 5.40 | 4.87 |
| Q50 | 0.00 | 0.00 | 0.00 | 0.00 | 2.45 | 0.00 | 0.00 | 0.00 | 0.00 | |
| sheep_numberimp | Mean | 1.78 | 0.28 | 0.72 | 0.40 | 0.75 | 0.54 | 1.11 | 0.37 | 1.14 |
| Q50 | 0.00 | 0.00 | 0.00 | 0.00 | 0.00 | 0.00 | 0.00 | 0.00 | 0.00 | |
| goat_numberimp | Mean | 3.14 | 1.00 | 1.09 | 1.33 | 2.25 | 1.15 | 1.16 | 1.52 | 1.13 |
| Q50 | 0.00 | 0.00 | 0.00 | 0.00 | 0.00 | 0.00 | 0.00 | 0.00 | 0.00 | |
| TLU_total | Mean | 1.72 | 0.36 | 0.33 | 0.33 | 0.79 | 0.54 | 0.72 | 0.34 | 0.49 |
| Q50 | 0.42 | 0.03 | 0.00 | 0.03 | 0.11 | 0.08 | 0.00 | 0.05 | 0.09 |
| LoCLoD | LoCMeD | LoCHiD | MeCLoD | MeCMeD | MeCHiD | HiCLoD | HiCMeD | HiCHiD | ||
|---|---|---|---|---|---|---|---|---|---|---|
| Variable | est. | est. | est. | est. | est. | est. | est. | est. | est. | |
| hhsize | Mean | 7 | 6 | 6 | 6 | 6 | 6 | 5 | 5 | 6 |
| Q50 | 7 | 6 | 6 | 6 | 6 | 6 | 5 | 5 | 6 | |
| (femhead * 100) | Mean | 11 | 19 | 21 | 13 | 10 | 14 | 13 | 18 | 11 |
| Q50 | 0 | 0 | 0 | 0 | 0 | 0 | 0 | 0 | 0 | |
| agehead | Mean | 52 | 58 | 54 | 58 | 62 | 56 | 54 | 54 | 54 |
| Q50 | 50 | 58 | 55 | 59 | 61 | 55 | 55 | 53 | 51 | |
| (lithead * 100) | Mean | 55 | 62 | 69 | 50 | 59 | 74 | 53 | 64 | 70 |
| Q50 | 100 | 100 | 100 | 0 | 100 | 100 | 100 | 100 | 100 | |
| eduyears | Mean | 7 | 8 | 8 | 7 | 8 | 9 | 6 | 8 | 8 |
| Q50 | 6 | 6 | 6 | 6 | 6 | 6 | 6 | 6 | 6 | |
| numchildren | Mean | 3 | 2 | 2 | 2 | 2 | 2 | 2 | 2 | 2 |
| Q50 | 3 | 1 | 2 | 2 | 1 | 2 | 1 | 1 | 2 | |
| equiv | Mean | 5 | 5 | 5 | 4 | 4 | 5 | 4 | 4 | 4 |
| Q50 | 5 | 4 | 4 | 4 | 4 | 4 | 3 | 4 | 4 | |
| females | Mean | 3 | 3 | 3 | 3 | 3 | 3 | 3 | 3 | 3 |
| Q50 | 3 | 3 | 3 | 3 | 3 | 3 | 2 | 3 | 3 | |
| males | Mean | 3 | 3 | 3 | 3 | 3 | 3 | 3 | 3 | 3 |
| Q50 | 3 | 2 | 3 | 3 | 3 | 3 | 2 | 2 | 3 | |
| sh_ed_none | Mean | 6 | 4 | 4 | 8 | 3 | 3 | 6 | 4 | 7 |
| Q50 | 0 | 0 | 0 | 0 | 0 | 0 | 0 | 0 | 0 | |
| sh_ed_prim | Mean | 62 | 58 | 46 | 59 | 43 | 44 | 64 | 62 | 55 |
| Q50 | 67 | 56 | 50 | 57 | 50 | 50 | 67 | 60 | 56 | |
| sh_ed_secu | Mean | 32 | 39 | 49 | 32 | 54 | 53 | 31 | 34 | 37 |
| Q50 | 25 | 40 | 50 | 25 | 50 | 50 | 25 | 33 | 35 |
| LoCLoD | LoCMeD | LoCHiD | MeCLoD | MeCMeD | MeCHiD | HiCLoD | HiCMeD | HiCHiD | ||
|---|---|---|---|---|---|---|---|---|---|---|
| Variable | est. | est. | est. | est. | est. | est. | est. | est. | est. | |
| parcels | Mean | 1.9 | 2.1 | 1.7 | 2.3 | 2.3 | 2.0 | 2.0 | 2.0 | 1.9 |
| Q50 | 2.0 | 2.0 | 1.0 | 2.0 | 2.0 | 2.0 | 2.0 | 2.0 | 2.0 | |
| (chempest_farms * 100) | Mean | 20.8 | 10.5 | 2.2 | 25.5 | 10.3 | 2.6 | 32.5 | 36.0 | 22.7 |
| Q50 | 0.0 | 0.0 | 0.0 | 0.0 | 0.0 | 0.0 | 0.0 | 0.0 | 0.0 | |
| (chemherb_farms * 100) | Mean | 26.8 | 12.0 | 11.6 | 35.3 | 20.5 | 8.9 | 32.9 | 29.8 | 21.2 |
| Q50 | 0.0 | 0.0 | 0.0 | 0.0 | 0.0 | 0.0 | 0.0 | 0.0 | 0.0 | |
| (fertorg_farms * 100) | Mean | 4.6 | 3.3 | 3.7 | 0.0 | 0.0 | 4.2 | 2.0 | 3.0 | 12.6 |
| Q50 | 0.0 | 0.0 | 0.0 | 0.0 | 0.0 | 0.0 | 0.0 | 0.0 | 0.0 | |
| (fertinorg_farms * 100) | Mean | 48.2 | 30.0 | 24.7 | 16.8 | 35.5 | 21.1 | 21.5 | 25.0 | 33.8 |
| Q50 | 0.0 | 0.0 | 0.0 | 0.0 | 0.0 | 0.0 | 0.0 | 0.0 | 0.0 | |
| (seedp_farms * 100) | Mean | 27.8 | 27.6 | 46.7 | 25.5 | 37.1 | 33.7 | 28.3 | 19.1 | 38.1 |
| Q50 | 0.0 | 0.0 | 0.0 | 0.0 | 0.0 | 0.0 | 0.0 | 0.0 | 0.0 | |
| (tractorown_farms * 100) | Mean | 1.2 | 2.6 | 2.2 | 1.0 | 1.6 | 0.0 | 6.7 | 2.8 | 0.6 |
| Q50 | 0.0 | 0.0 | 0.0 | 0.0 | 0.0 | 0.0 | 0.0 | 0.0 | 0.0 | |
| intens_idx2 | Mean | 1.4 | 0.8 | 0.9 | 0.8 | 1.0 | 0.7 | 1.1 | 1.1 | 1.3 |
| Q50 | 1.0 | 0.5 | 1.0 | 0.7 | 0.8 | 0.8 | 1.0 | 1.0 | 1.0 |
| LoCLoD | LoCMeD | LoCHiD | MeCLoD | MeCMeD | MeCHiD | HiCLoD | HiCMeD | HiCHiD | ||
|---|---|---|---|---|---|---|---|---|---|---|
| Variable | est. | est. | est. | est. | est. | est. | est. | est. | est. | |
| pcexp_ppp_m | Mean | 29.7 | 26.6 | 39.7 | 32.7 | 39.7 | 33.5 | 38.2 | 54.6 | 46.2 |
| Q50 | 21.6 | 22.2 | 24.4 | 26.4 | 36.7 | 26.2 | 27.3 | 44.9 | 30.9 | |
| foodexp_ppp_m | Mean | 23.0 | 18.8 | 24.1 | 24.0 | 27.3 | 24.7 | 29.8 | 39.5 | 32.4 |
| Q50 | 17.0 | 14.9 | 16.2 | 18.5 | 26.3 | 19.5 | 21.9 | 32.0 | 24.3 | |
| nfoodexp_ppp_m | Mean | 6.6 | 7.7 | 15.6 | 8.6 | 12.4 | 8.8 | 8.4 | 15.1 | 13.8 |
| Q50 | 4.1 | 5.0 | 6.9 | 5.2 | 6.9 | 7.0 | 6.3 | 9.1 | 7.5 | |
| (poor_ppp1 * 100) | Mean | 74.3 | 80.8 | 71.3 | 68.4 | 51.8 | 64.2 | 66.3 | 36.9 | 59.0 |
| Q50 | 100.0 | 100.0 | 100.0 | 100.0 | 37.4 | 100.0 | 100.0 | 0.0 | 100.0 | |
| (poor_ppp2 * 100) | Mean | 90.6 | 93.0 | 82.5 | 86.1 | 89.9 | 91.0 | 83.9 | 68.9 | 83.2 |
| Q50 | 100.0 | 100.0 | 100.0 | 100.0 | 100.0 | 100.0 | 100.0 | 100.0 | 100.0 | |
| (povgap_ppp1 * 100) | Mean | 38.3 | 39.5 | 34.3 | 33.7 | 17.5 | 30.6 | 27.9 | 14.6 | 24.7 |
| Q50 | 43.1 | 36.1 | 35.8 | 29.6 | 0.0 | 30.5 | 27.7 | 0.0 | 17.1 | |
| (povgap_ppp2 * 100) | Mean | 55.3 | 57.8 | 50.5 | 50.4 | 38.5 | 50.0 | 45.4 | 29.7 | 42.3 |
| Q50 | 64.5 | 60.0 | 59.9 | 56.0 | 35.3 | 56.5 | 54.8 | 24.5 | 48.2 | |
| (sevpov_ppp1 * 100) | Mean | 23.6 | 23.2 | 19.6 | 20.6 | 7.7 | 17.9 | 14.6 | 7.6 | 13.0 |
| Q50 | 18.6 | 13.1 | 12.8 | 8.7 | 0.0 | 9.3 | 7.7 | 0.0 | 2.9 | |
| (sevpov_ppp2 * 100) | Mean | 38.6 | 39.8 | 34.4 | 34.5 | 20.5 | 32.4 | 28.9 | 16.6 | 26.1 |
| Q50 | 41.6 | 36.1 | 35.8 | 31.3 | 12.5 | 32.0 | 30.1 | 6.0 | 23.2 |
References
Girei, A. A., Saingbe, N. D., Bitrus, M. A., & Bassey, I. H. (2017). Revealing the Impact of Fadama III Project on the Income Level of Beneficiary Farmers in Plateau State, Nigeria. European Journal of Academic Essays, (4(2): 26-38). Retrieved from http://euroessays.org/wp-content/uploads/2017/02/EJAE-1611-547.pdf
FAO. (2016). Components of Income Aggregate: Nigeria General Household Survey 2012-2013. Rural Income Generating Activities (RIGA) Project. Food and Agriculture Organization (FAO). Retrieved from http://www.fao.org/economic/riga/riga-database/riga-survey/en/