3.2 Ghana
Relevant sources of household-level micro records for Ghana are the 6 rounds of Ghana Living Standards Surveys in particular:
- 1998/1999 GLSS4 (EAs were first stratified into 3 ecological zones (Coastal, Forest, Savannah), and then within each zone further stratification was done into rural or urban areas)
- 2005/2006 GLSS5 (EAs were first stratified into 10 administrative regions; within each region EAs were further sub-divided into rural or urban areas; EAs were also classified into ecological zones and inclusion of Accra (GAMA) so that the survey results may be presented across 1) Coastal, 2) Forest, and 3) Northern Savannah, and 4) Accra).
- 2012/2013 GLSS6 (EAs were allocated into 10 regions using probability proportional to population size (PPS), then further divided into urban and rural localities).
In contrast to the latest 2 waves GLSS4 is only representative for 3 (ecology) x 2 (rural/urban) zones.
GLSS collect information on the demographic characteristics of the population, their education, health, employment and time use, migration, housing conditions and household agriculture, with a specific focus on labour force, with a labour force module expanded in GLSS6 to include a section on child labour.
| Survey | Year | Regions | Districts | Sample | Urban | Rural |
|---|---|---|---|---|---|---|
| GLSS4 | 1997/98 | 10 | 102 | 5,998 | 2,199 | 3,799 |
| GLSS5 | 2005/06 | 10 | 110 | 8,687 | 3,618 | 5,069 |
| GLSS6 | 2012/13 | 10 | 170 | 16,772 | 7,445 | 9,327 |
RIGA aggregates were used to estimate both crop sales and farm vs. non-farm income.
3.2.1 Cultivated Area
RIGA does not provide annual cultivated area, instead we have measures of land owned, land rented out, and land under sharecropping. IFPRI/HarvestChoice produced pseudo-panel variables \(landcul\) and \(landown\) (but the results look a little dubious for GLSS4, see 3.16 below). Using operated area derived from RIGA instead (i.e. \(croparea=landown+landshare-landrent\)) does yield higher proportions of households for GLSS4 but lower for GLSS6. In general GLSS4 seems to exhibit poorer data quality.
| Percent oh Hhlds with Cultivated Area | ||||||
|---|---|---|---|---|---|---|
| IFPRI (landcult) | IFPRI (landown) | RIGA | ||||
| Year | rural | urban | rural | urban | rural | urban |
| 1998 | 13.2 | 3.7 | 37.1 | 12.5 | 35.9 | 11.2 |
| 1999 | 9.0 | 1.1 | 34.0 | 9.2 | 29.5 | 9.3 |
| 2005 | 83.6 | 24.4 | 56.9 | 20.1 | 72.5 | 32.2 |
| 2006 | 83.6 | 19.6 | 51.4 | 12.5 | 69.8 | 17.2 |
| 2012 | 76.7 | 23.5 | 100.0 | 100.0 | 59.5 | 25.7 |
| 2013 | 78.6 | 20.1 | 99.6 | 97.1 | 61.6 | 17.3 |
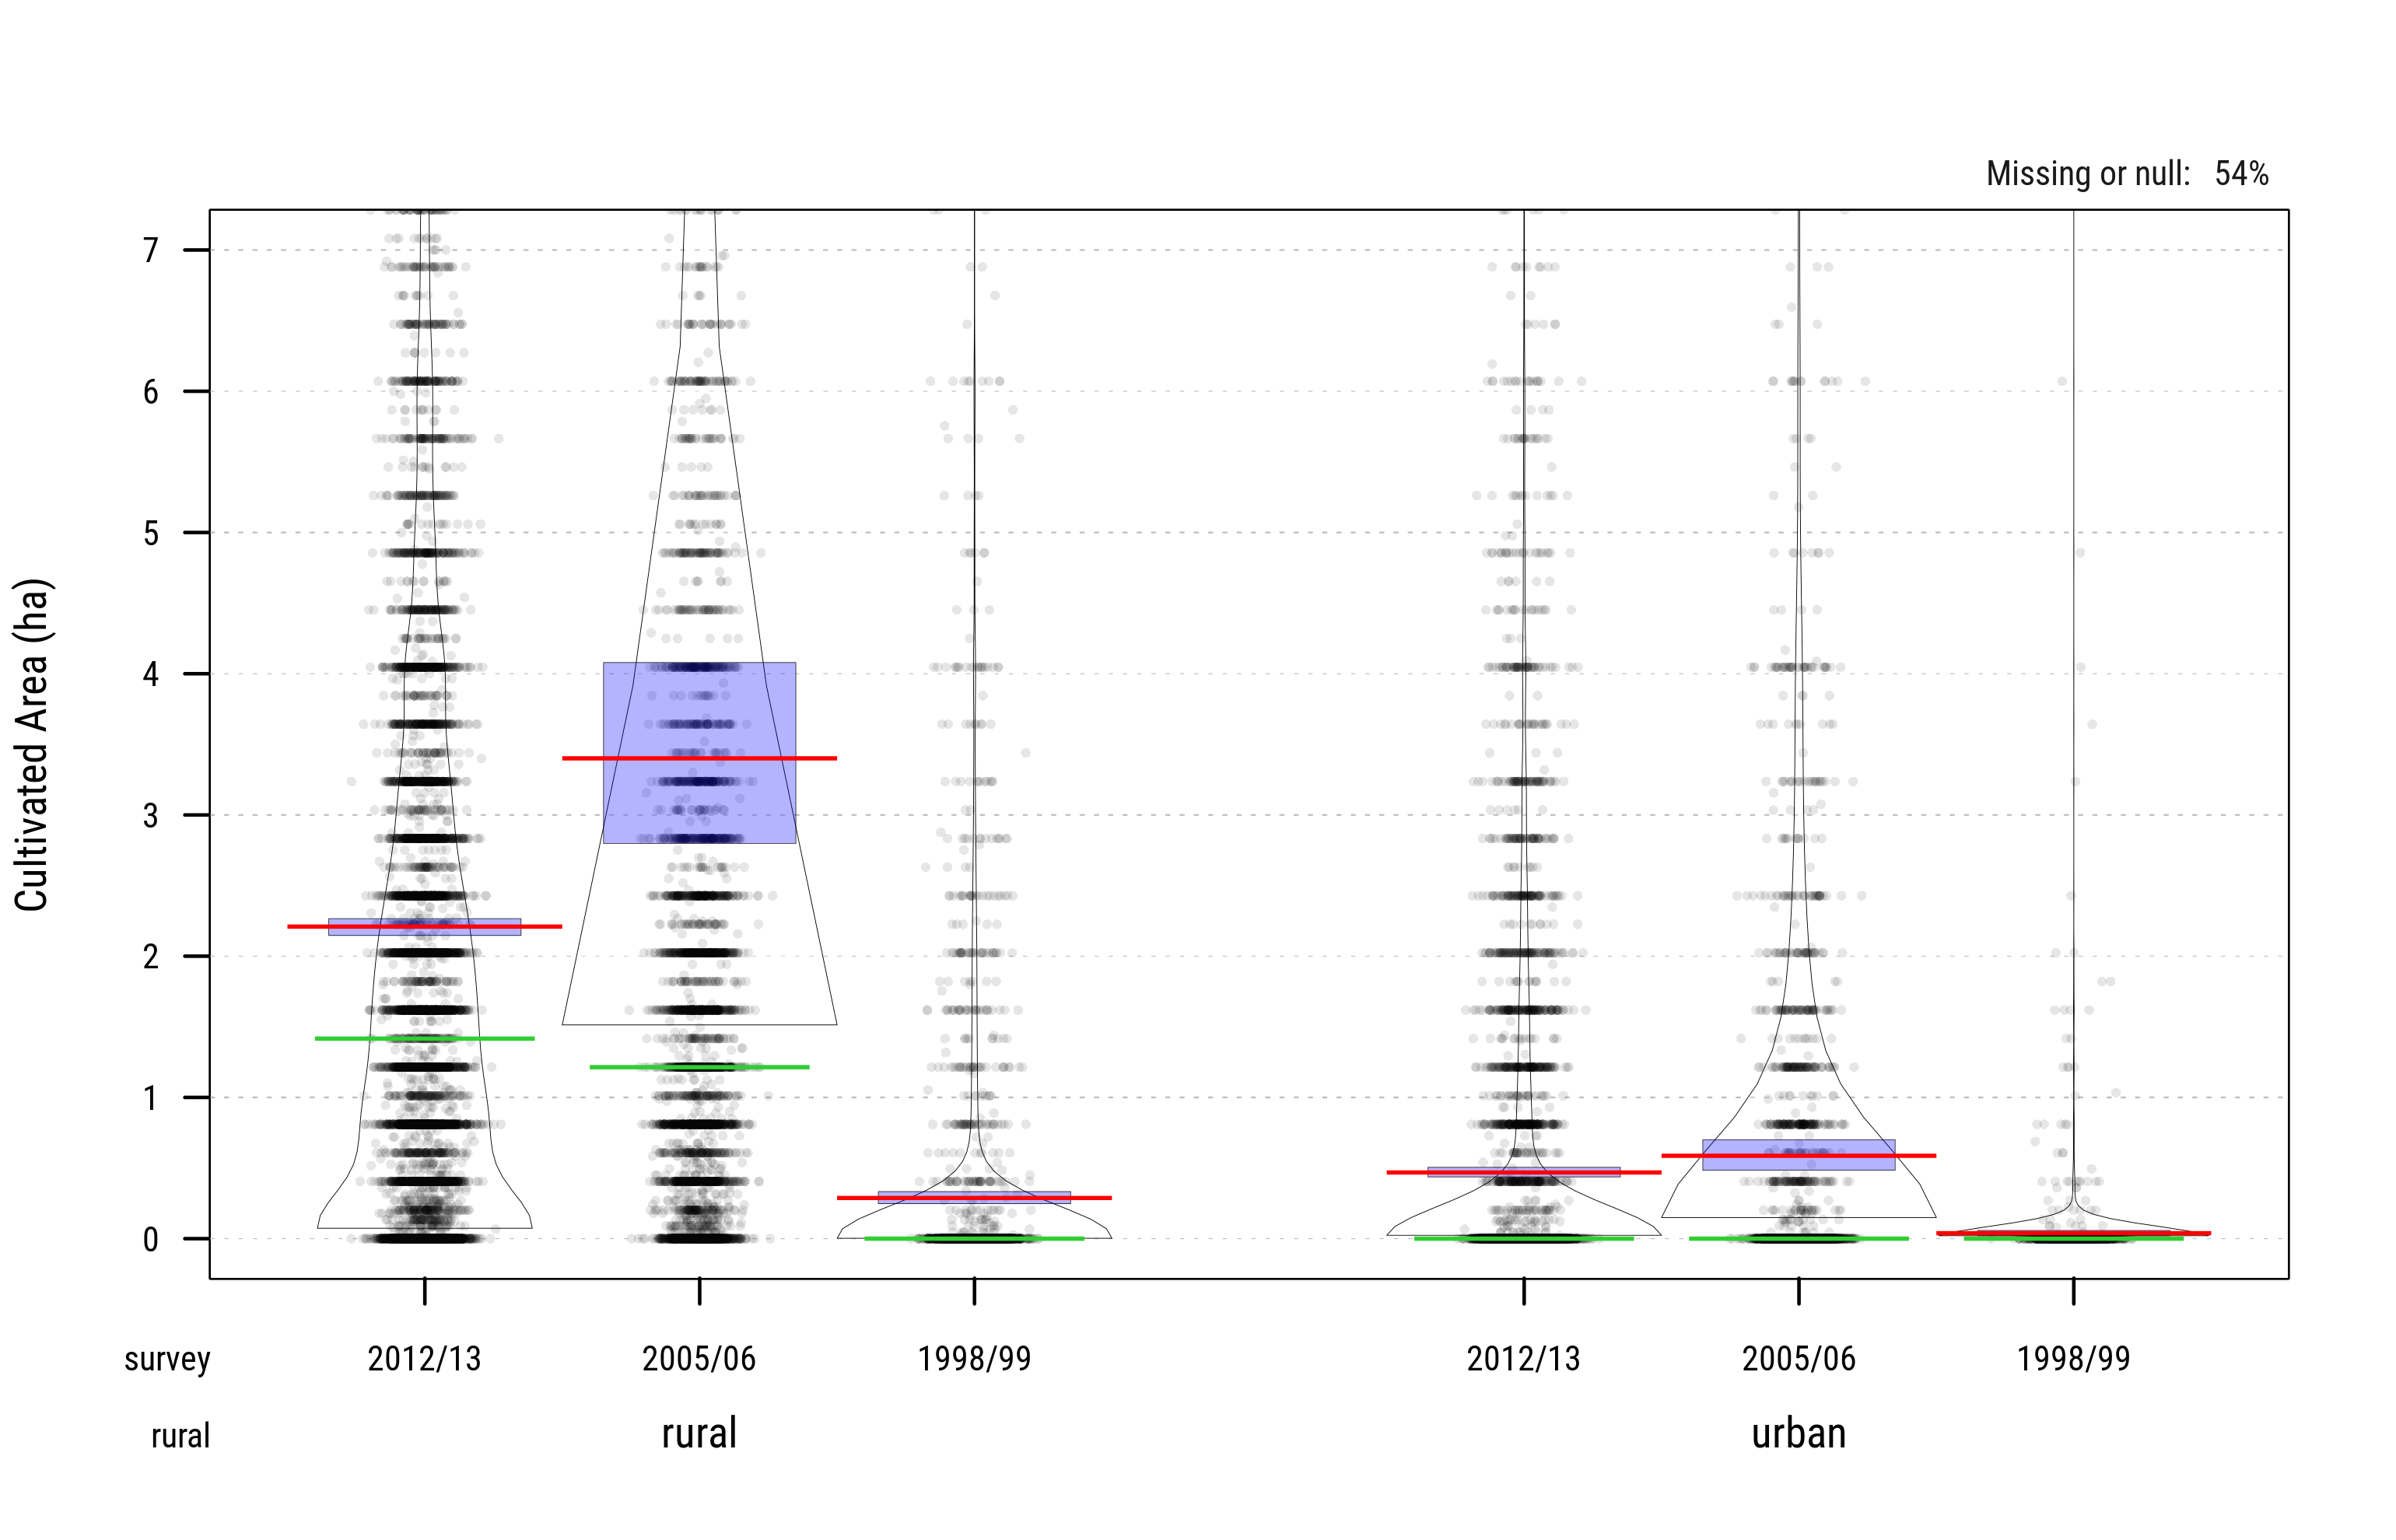
Fig. 3.8: Cultivated Area (ha). Source: IFPRI 2016
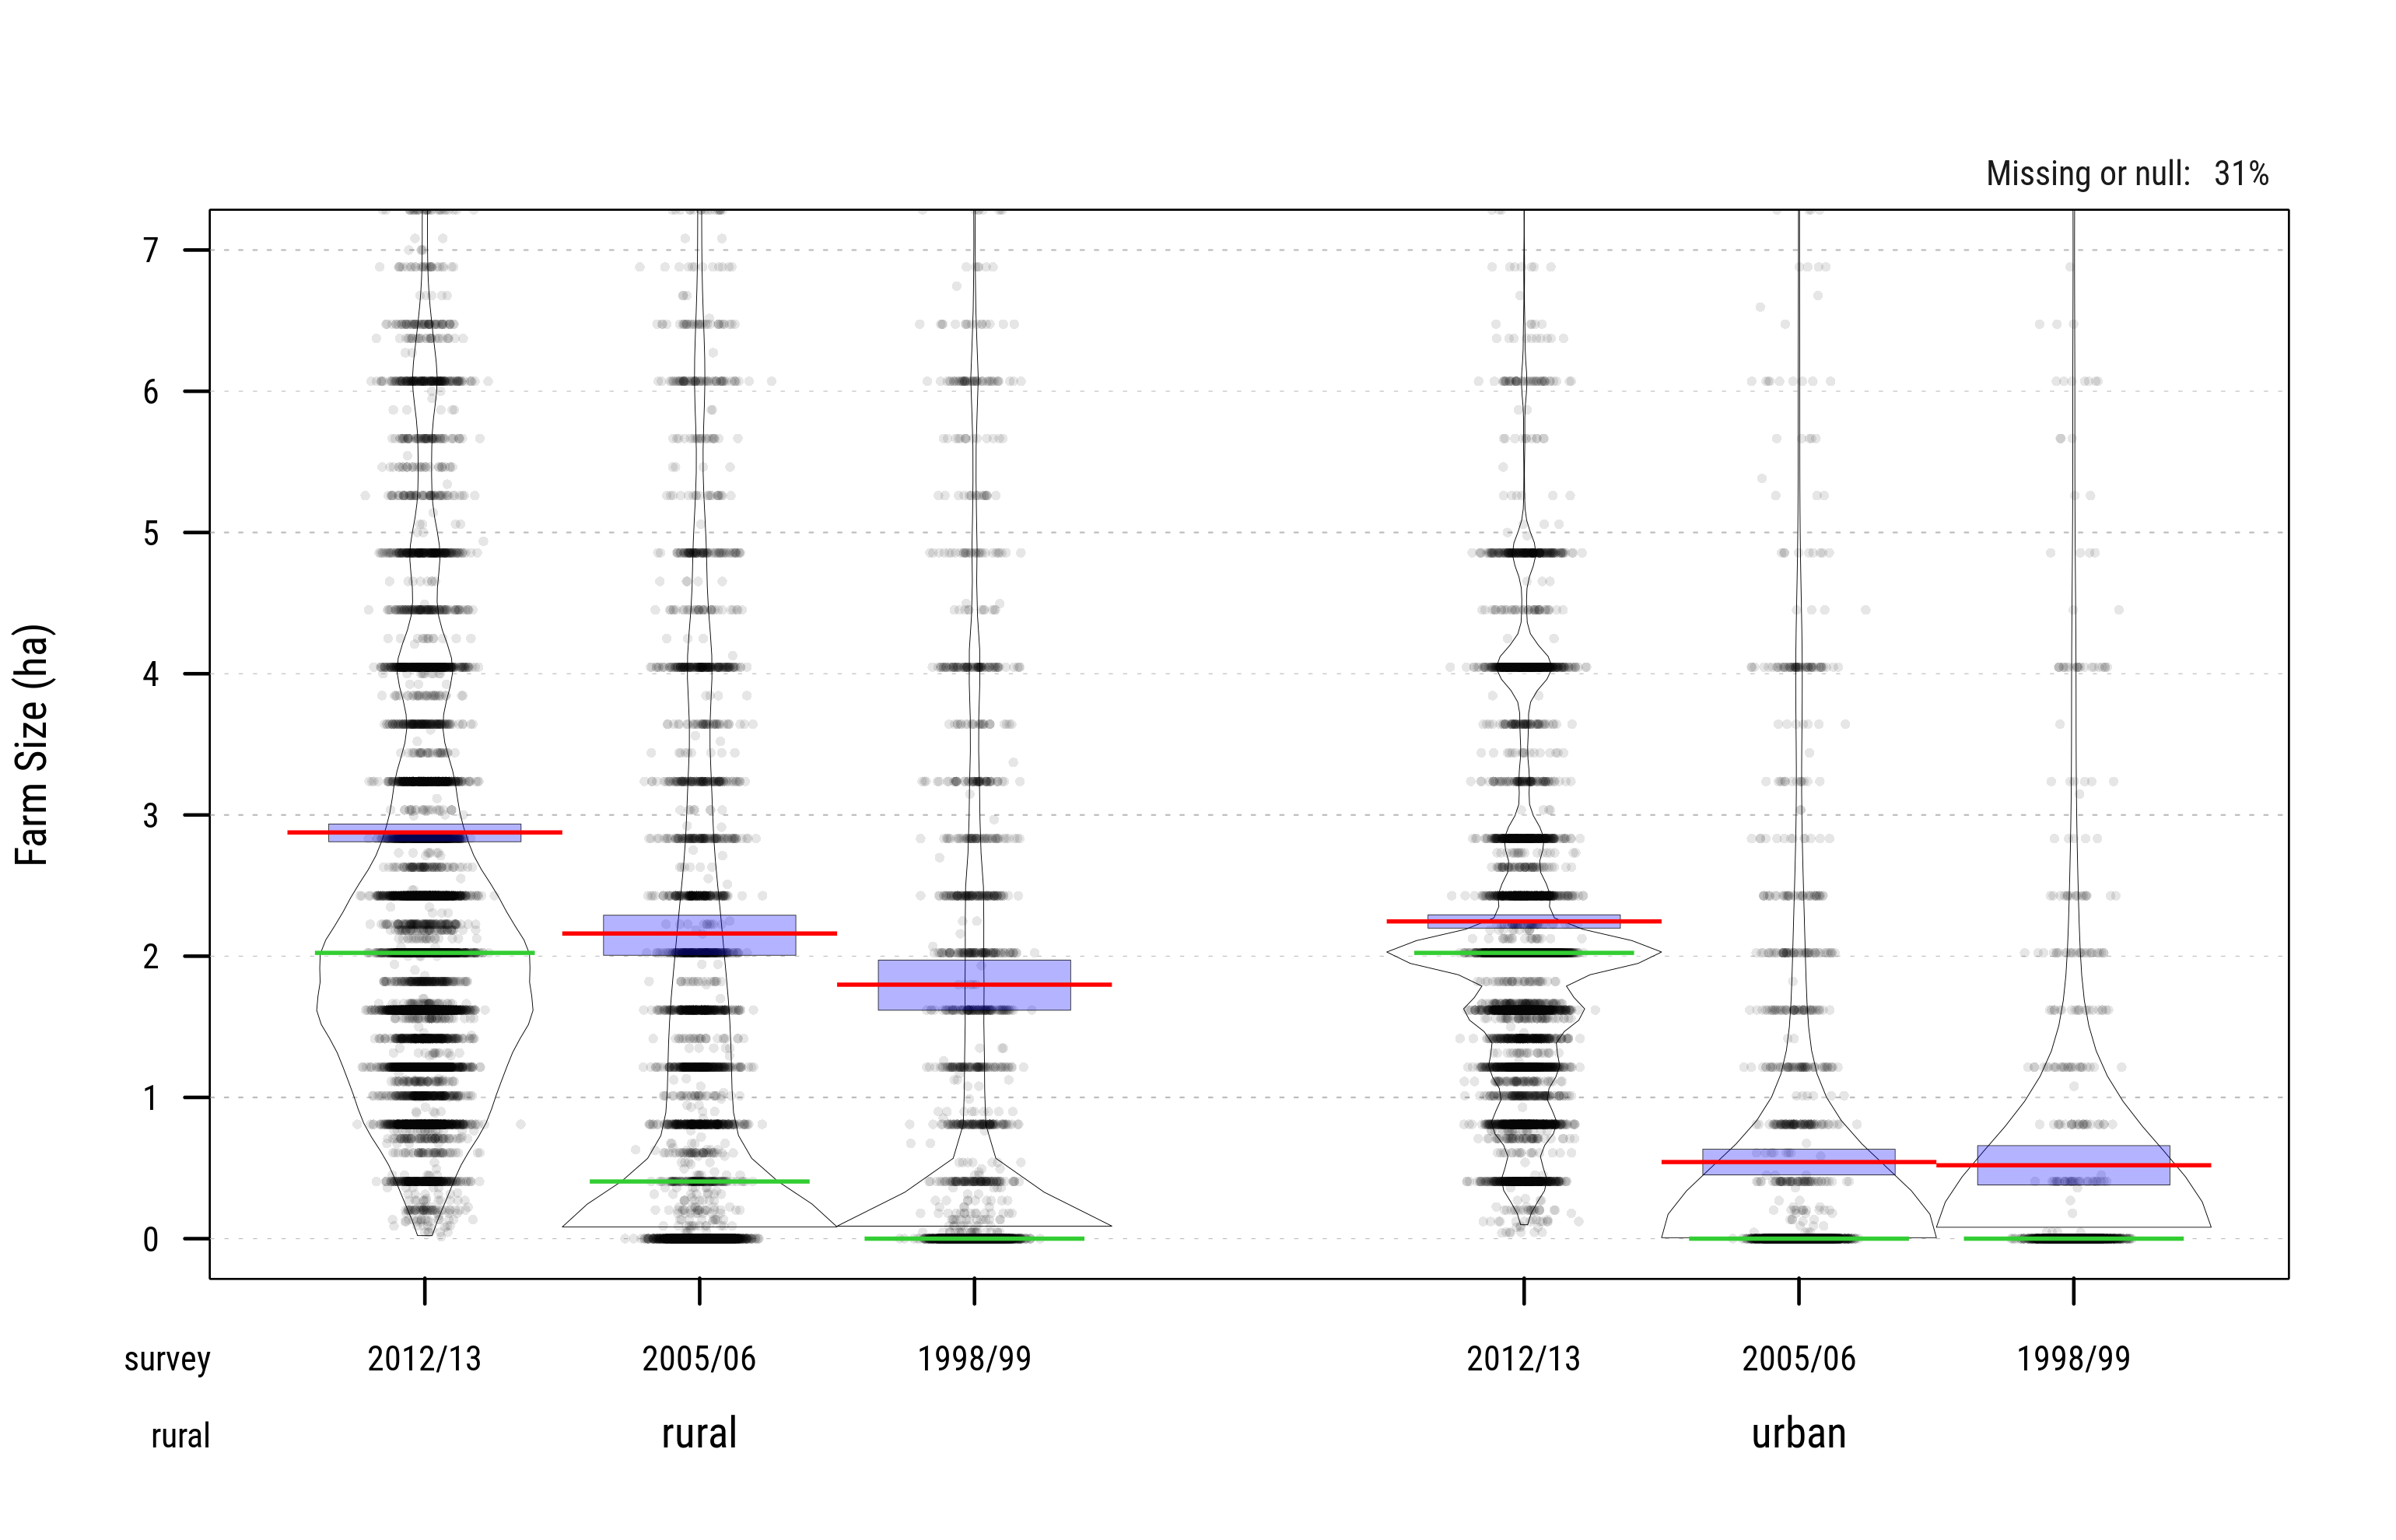
Fig. 3.9: Farm Size (ha). Source: IFPRI 2016
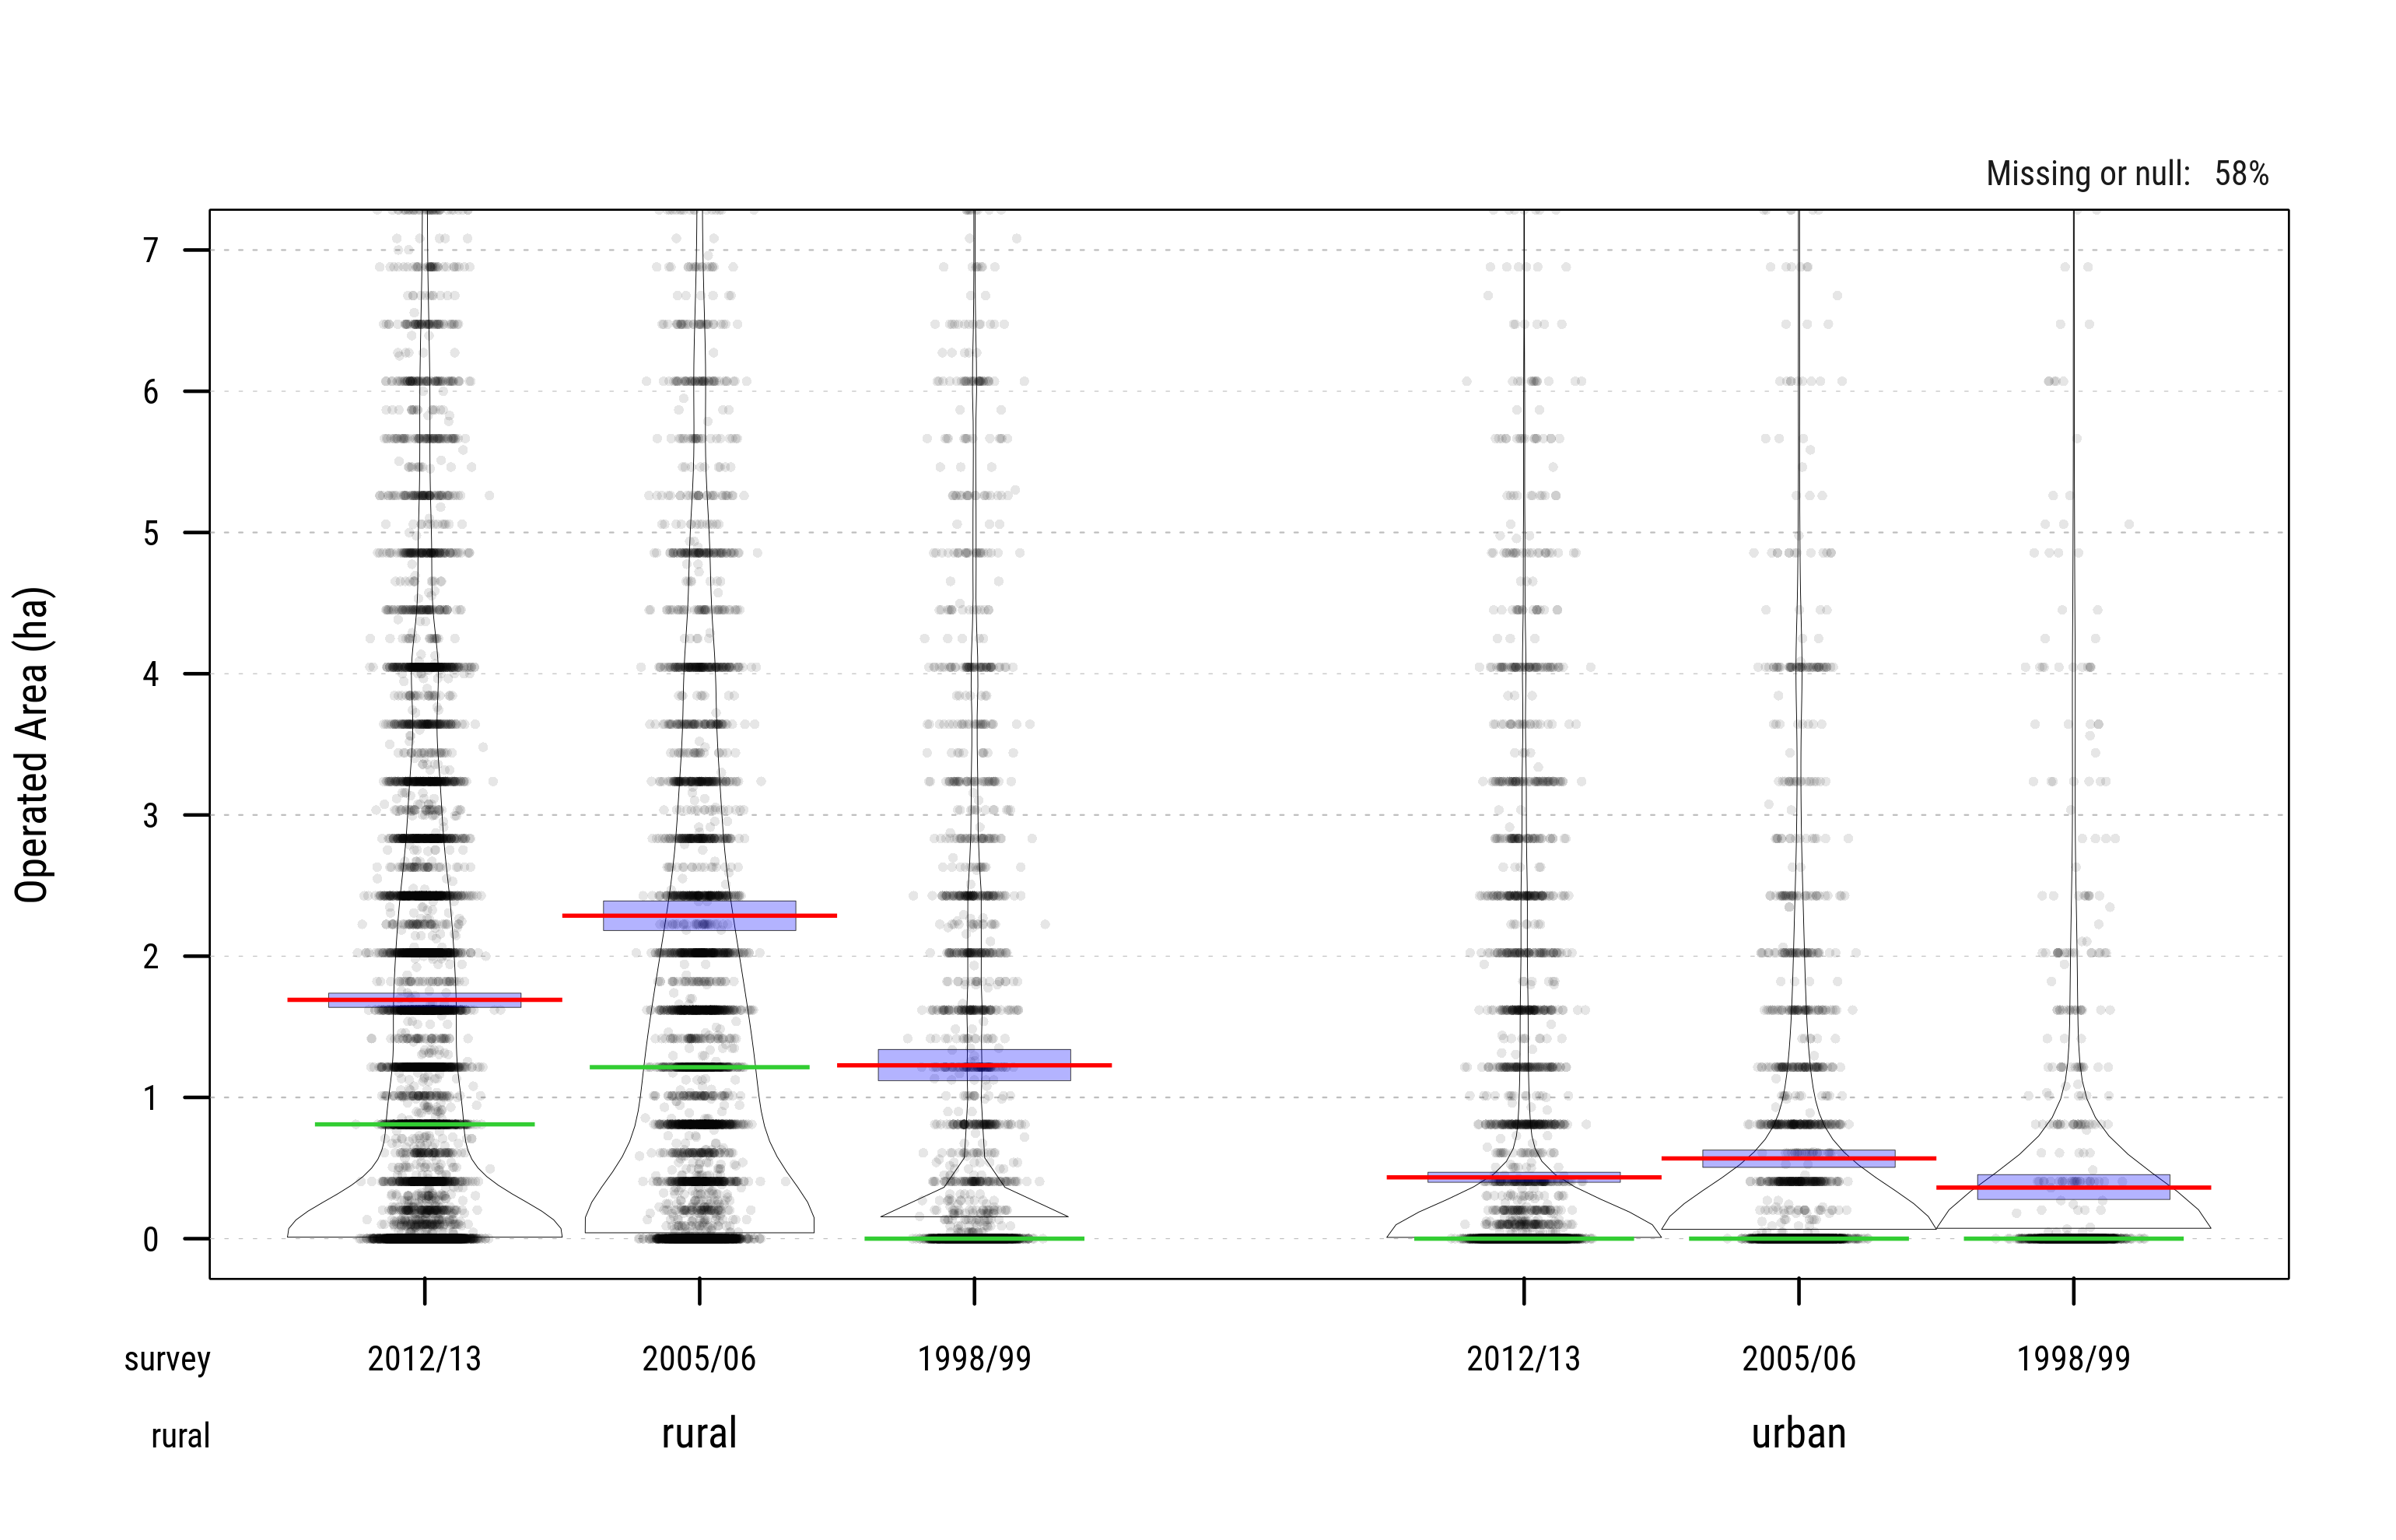
Fig. 3.10: Operated Area (ha). Source: FAO/RIGA
In the following classification we use option #3 (FAO/RIGA operated area) across the 3 waves.
| \(\leq\) 2 ha | 2-4 ha | \(>\) 4 ha | N (sample) | |
|---|---|---|---|---|
| 2012/13 | 5,258 | 2,485 | 1,725 | 16,772 |
| 2005/06 | 2,961 | 1,249 | 1,152 | 8,687 |
| 1998/99 | 1,865 | 1,769 | 435 | 5,998 |
| All | 10,084 | 5,503 | 3,312 | 31,457 |
| \(\leq\) 2 ha | 2-4 ha | \(>\) 4 ha | |
|---|---|---|---|
| 2012/13 | 31.3 | 14.8 | 10.3 |
| 2005/06 | 34.1 | 14.4 | 13.3 |
| 1998/99 | 31.1 | 29.5 | 7.3 |
| All | 32.1 | 17.5 | 10.5 |
| \(\leq\) 2 ha | 2-4 ha | \(>\) 4 ha | All | |
|---|---|---|---|---|
| 2012/13 | 55.5 | 26.2 | 18.2 | 100.0 |
| 2005/06 | 55.2 | 23.3 | 21.5 | 100.0 |
| 1998/99 | 45.8 | 43.5 | 10.7 | 100.0 |
| All | 53.4 | 29.1 | 17.5 | 100.0 |
We further impute cultivated area for households with some amount of crop production and crop sales to ensure internal consistency in the sample (over 5,700 households reported crop sales but no cultivated area). Figure 3.11 below show cultivated area post-imputation.
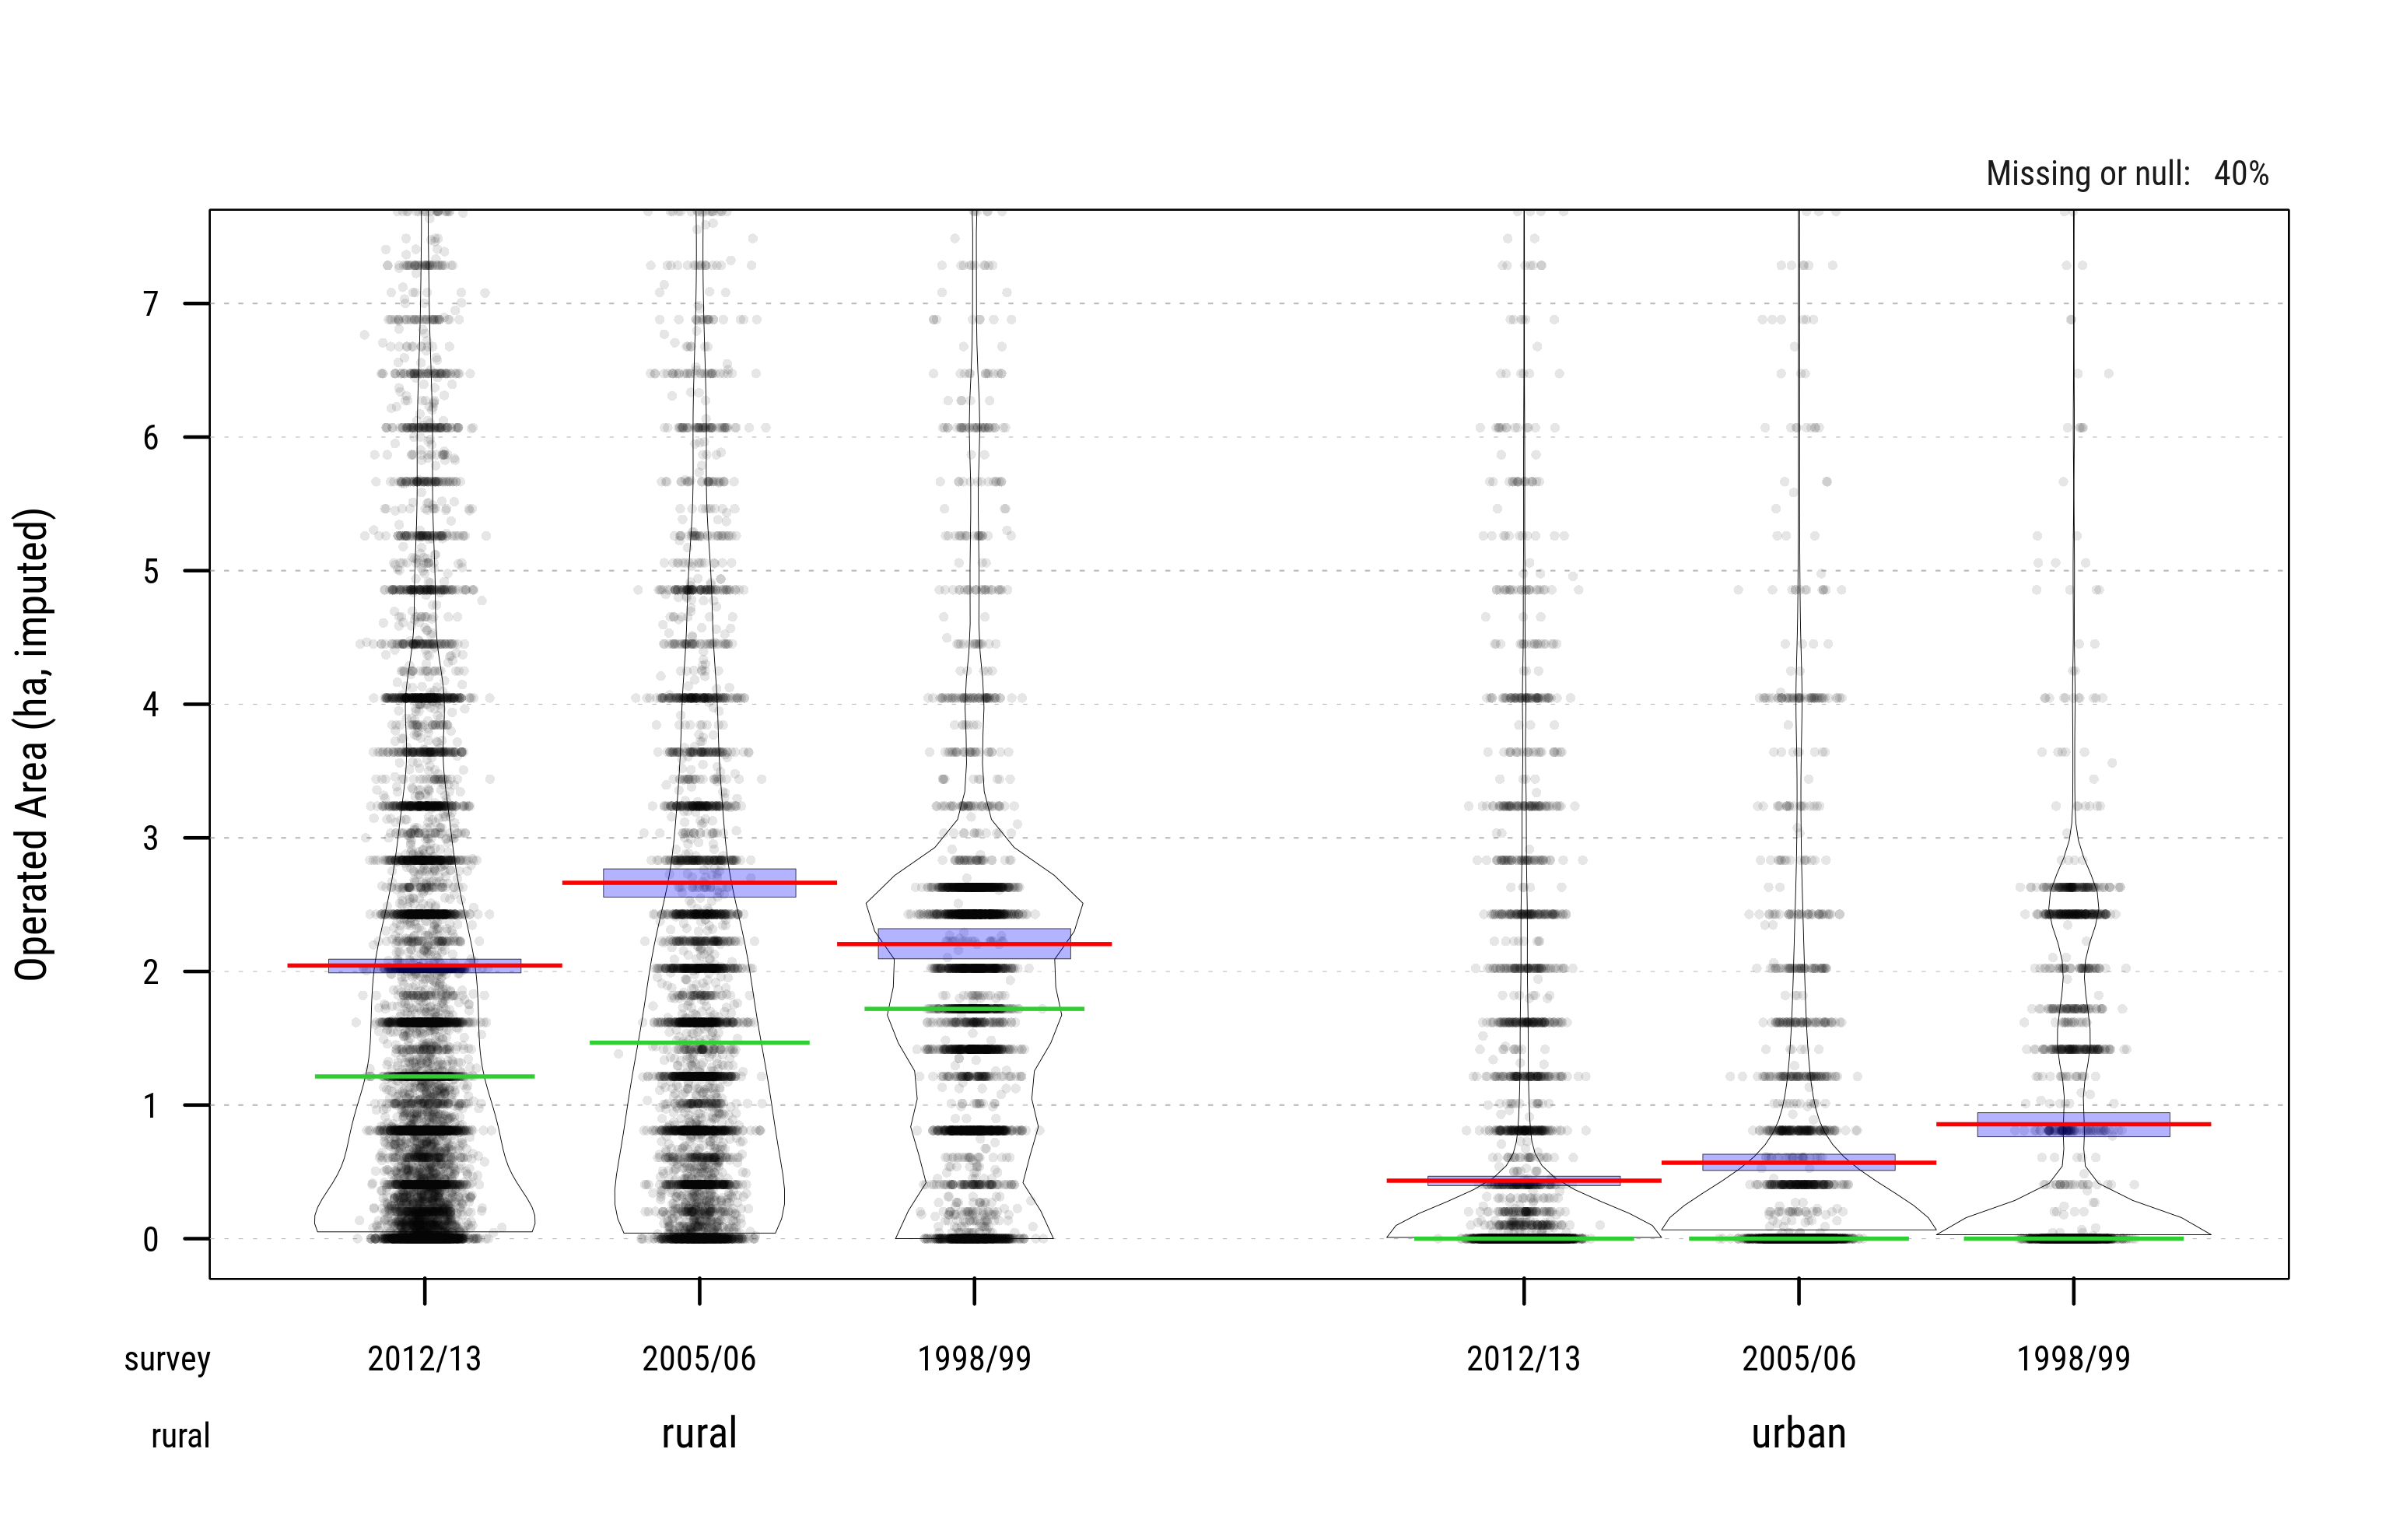
Fig. 3.11: Cultivated Area (ha) (post-imputation)
3.2.2 Crop Commercialization
We evaluate multiple sources (and/or proxies) of aggregate household crop sales (again from FAO/RIGA and separately from IFPRI). Generally RIGA reports gross crop production, crop sales, and share of crop production sold in \(totcropprod\), \(totcropsold\), and \(shcropsold\) respectively. All other relevant variables are listed here:
- \(totcropprod\) – value of total annual crop production
- \(totcropsold\) – value of total annual crop production sold
- \(totagprod\) – value of total annual agricultural production
- \(totagsold\) – value of total annual agricultural production sold
- \(totlvstprod\) – value of total annual livestock production
- \(totlivsold\) – value total annual livestock production sold
- \(agowncons\) – value total annual agricultural production consumed
- \(agmisc\) – value total annual agricultural production- miscellaneous uses
- \(shagprodsold\) – share of annual agricultural production sold in total agricultural production
- \(shagowncons\) – share of annual agricultural production consumed in total agricultural productio
- \(shagmisc\) – share of annual agricultural production misc in total agricultural production
- \(shcropsold\) – share of total annual crop production sold in total crop production
- \(shlvstsold\) – share of total annual livestock production sold in total livestock production
- \(cropincome1gross(imp)\) – gross crop income (crop1)
- \(cropincome2gross(imp)\) – gross crop income (crop2)
- \(livestockgross(imp)\) – gross livestock income
However the quality of these constructed variables for Ghana tends to vary widely across survey years.
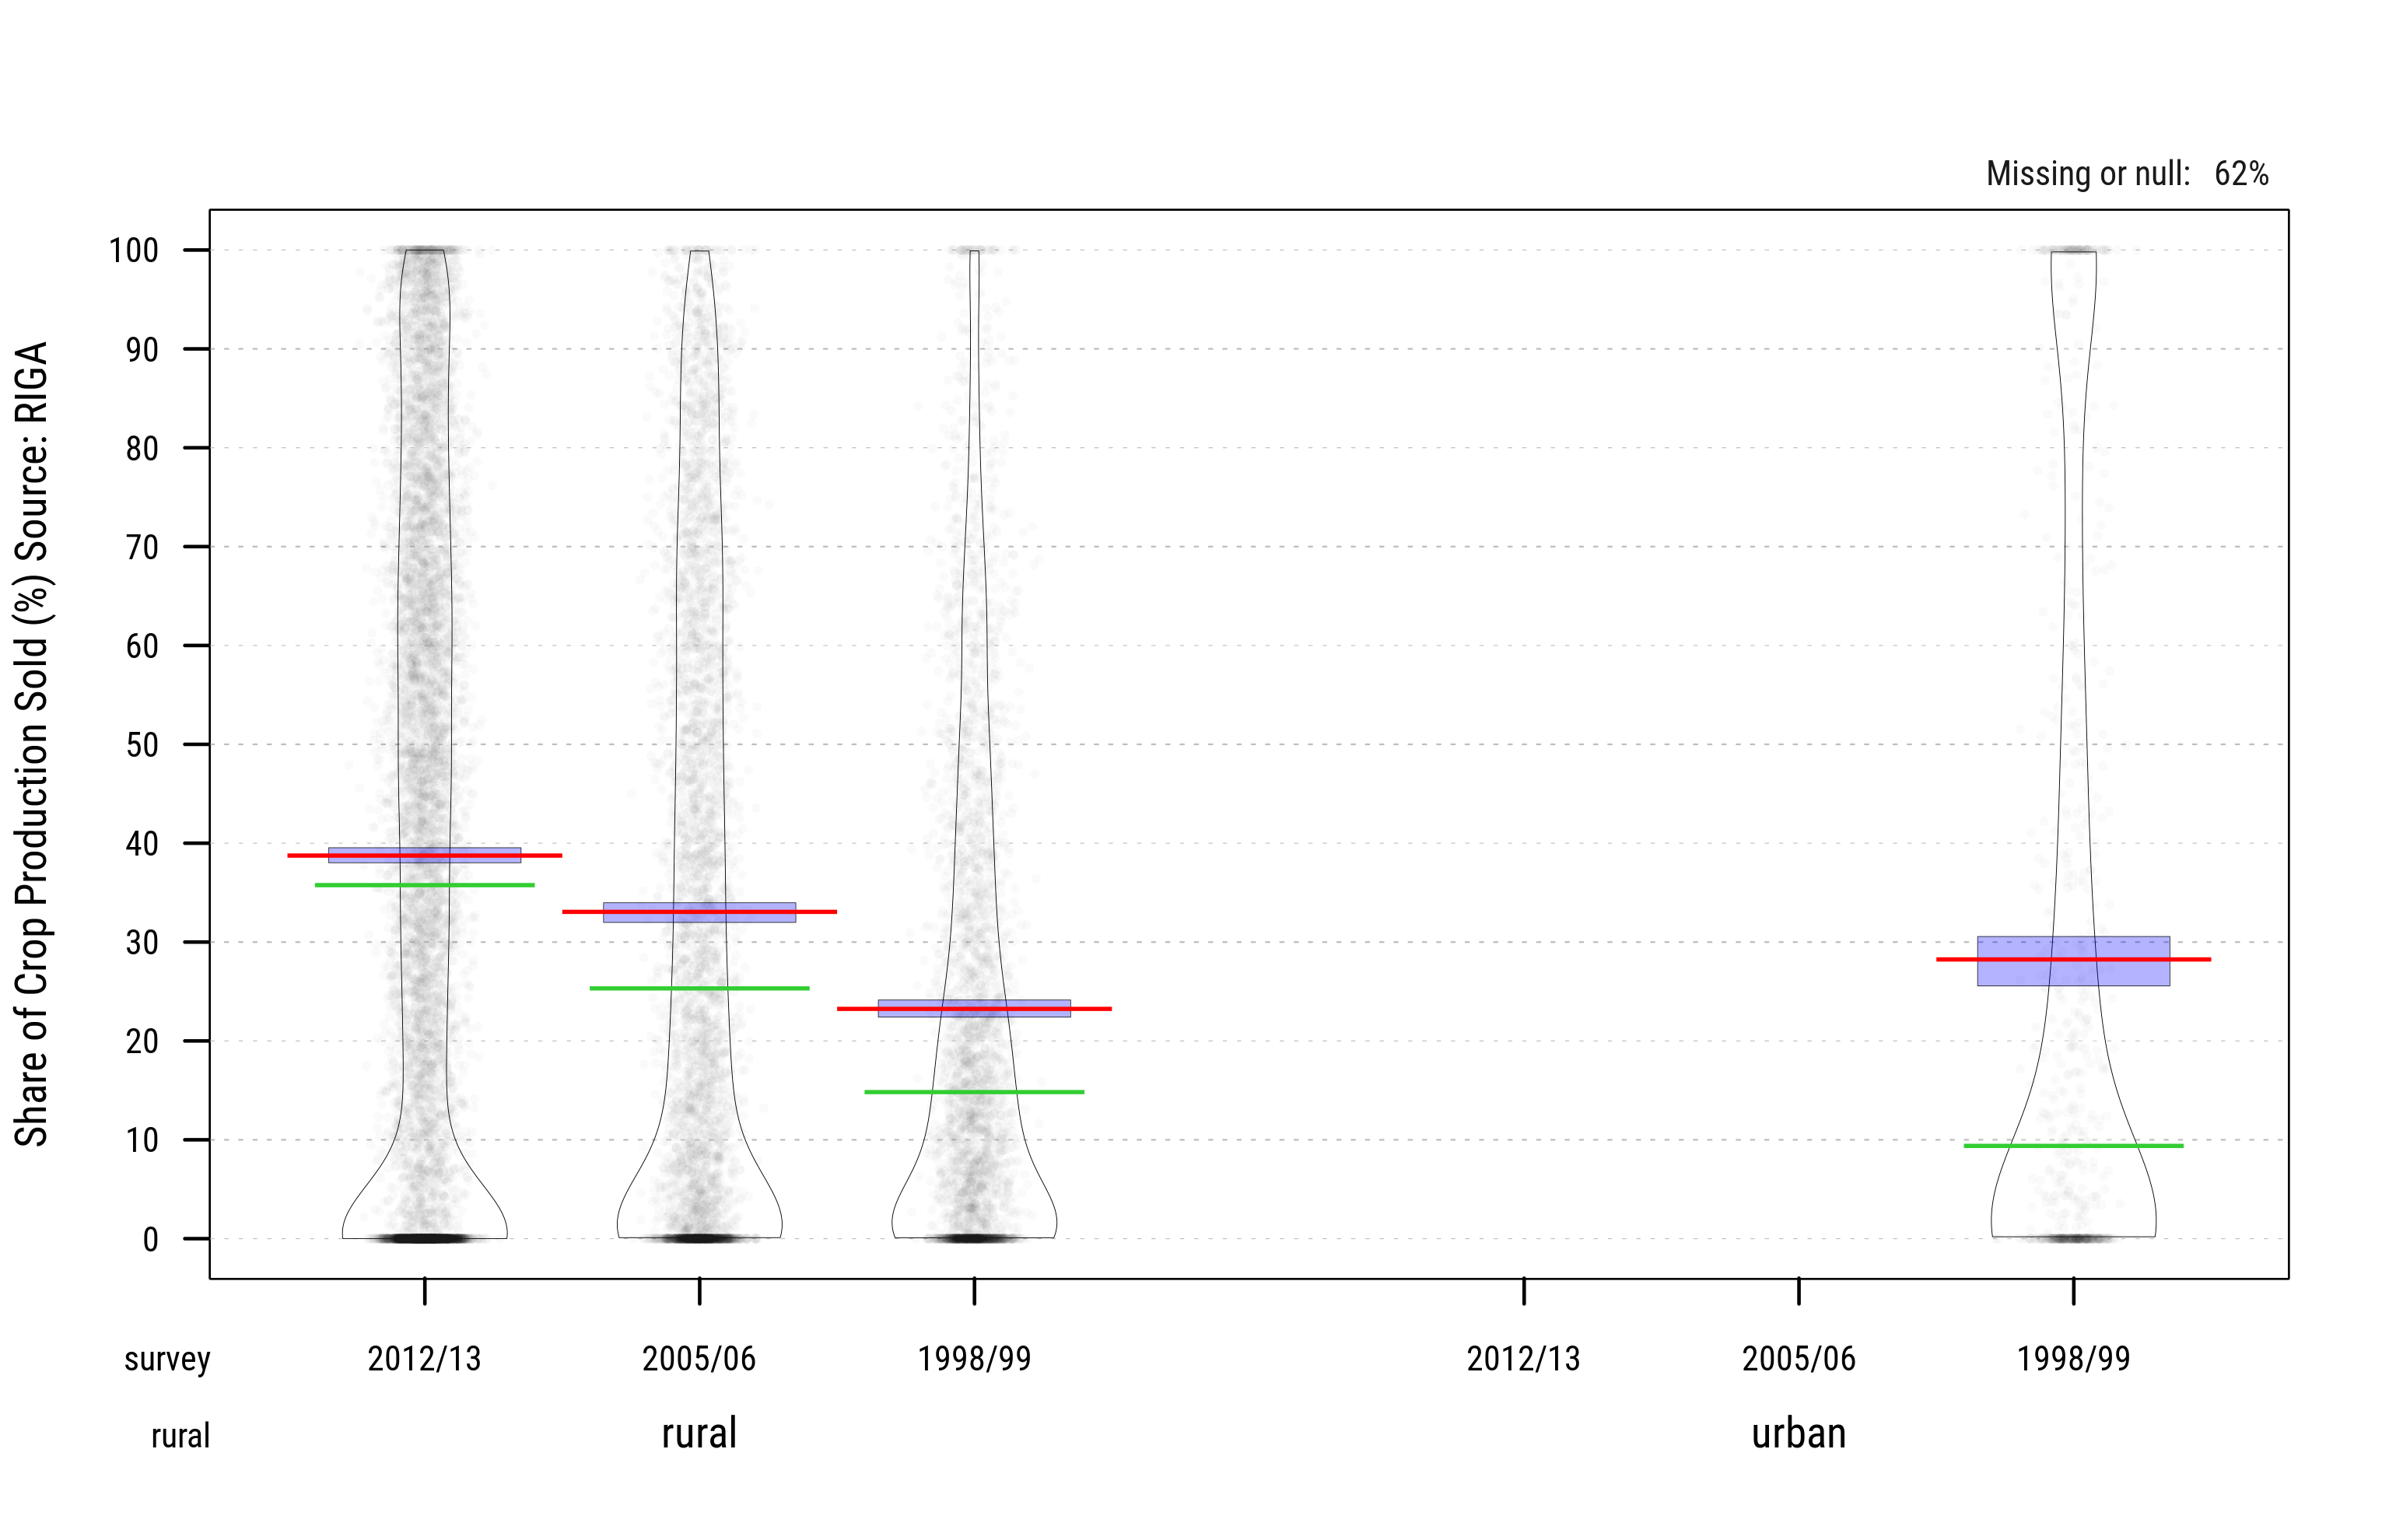
Fig. 3.12: Sources of Crop Commercialization (FAO/RIGA \(totcropsold\))
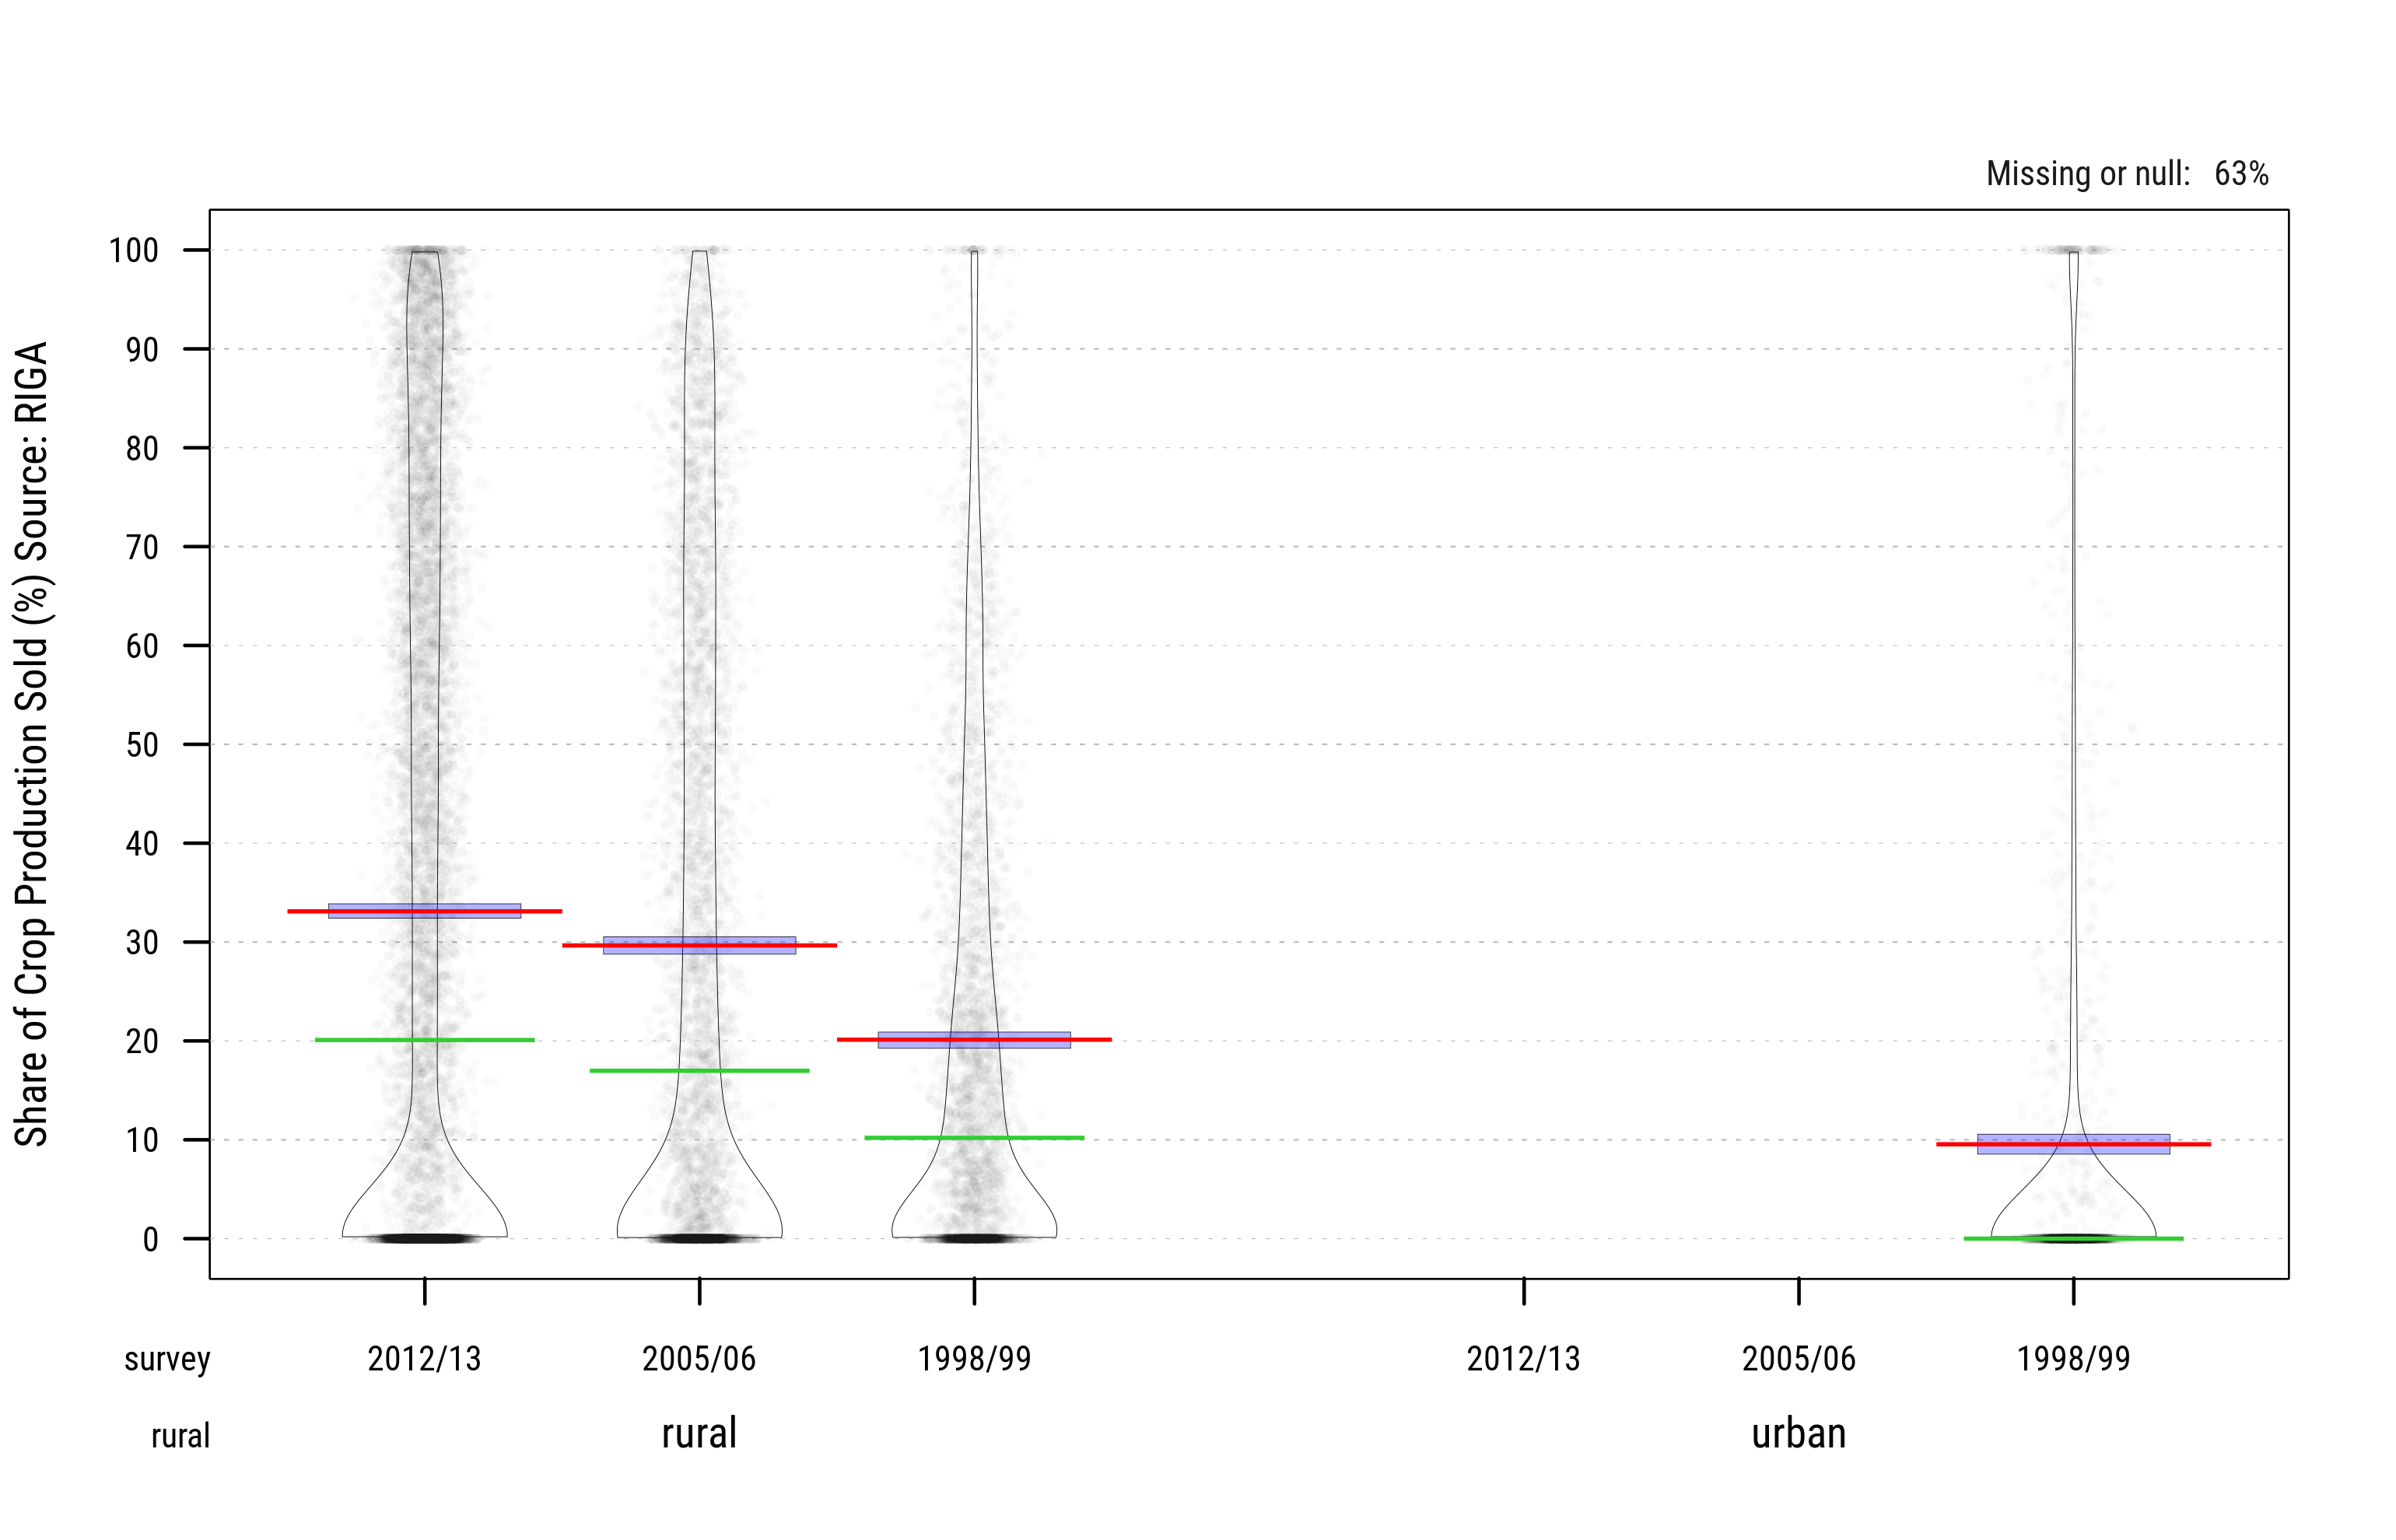
Fig. 3.13: Sources of Crop Commercialization (FAO/RIGA \(shcropsold\))
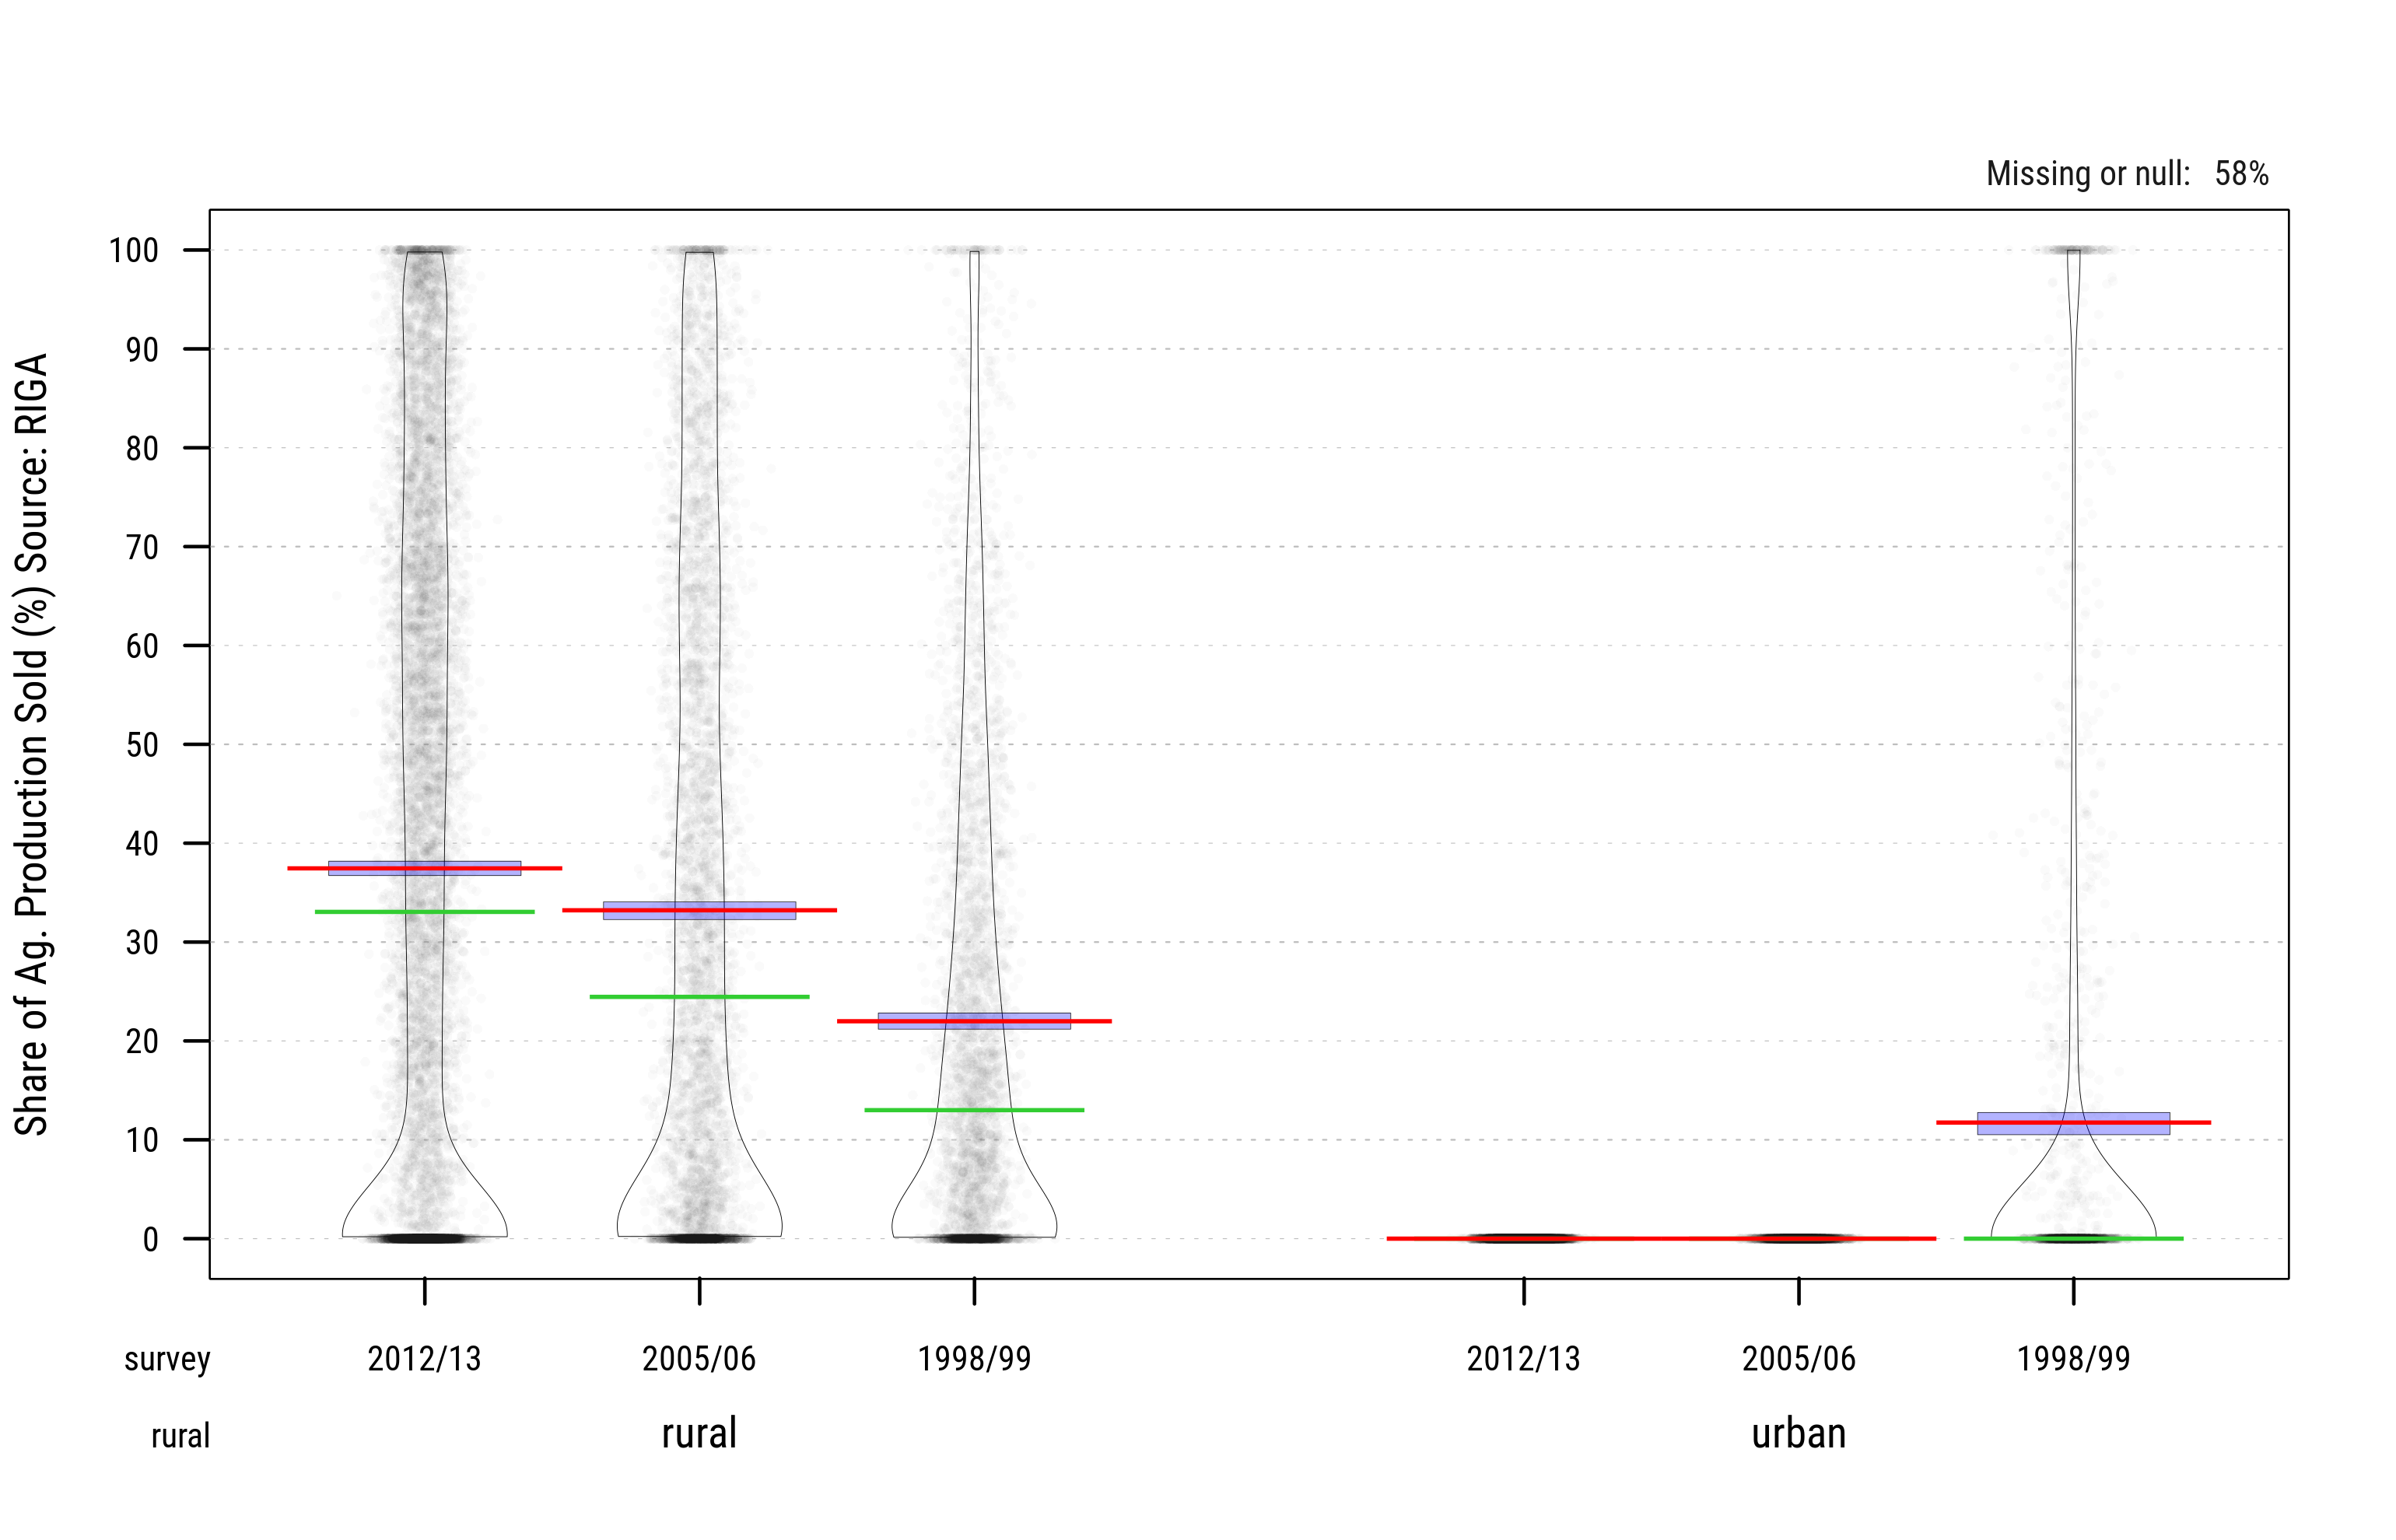
Fig. 3.14: Sources of Crop Commercialization (FAO/RIGA \(shagprodsold\))
Looking at the pirate plots above (and tables below), sales from agricultural products for urban households seem to have been excluded from RIGA aggregates (though that’s not the case for GLSS4) OR urban households have largely abandoned farming over the past 12 years (also possible).
| Hhlds with Gross Ag Income | Hhlds with no Revenue from Farming | Hhlds with Ag. Sales | HHlds with Crop Sales | Share of Crop Sales in Ag Sales | ||||||
|---|---|---|---|---|---|---|---|---|---|---|
| Wave | rural | urban | rural | urban | rural | urban | rural | urban | rural | urban |
| 2012/13 | 85.8 | 1.8 | 14.2 | 98.2 | 68.5 | 0.0 | 58.8 | 0.0 | 85.8 | NA |
| 2005/06 | 87.4 | 2.5 | 12.6 | 97.5 | 73.6 | 0.0 | 64.5 | 0.0 | 87.7 | NA |
| 1998/99 | 86.7 | 36.8 | 13.3 | 63.2 | 70.7 | 23.9 | 64.8 | 20.1 | 91.7 | 84.0 |
In the rest of the analysis we use FAO/RIGA share of agricultutal products sold \(shagprodsold\) as a proxy measure of crop commercialization.
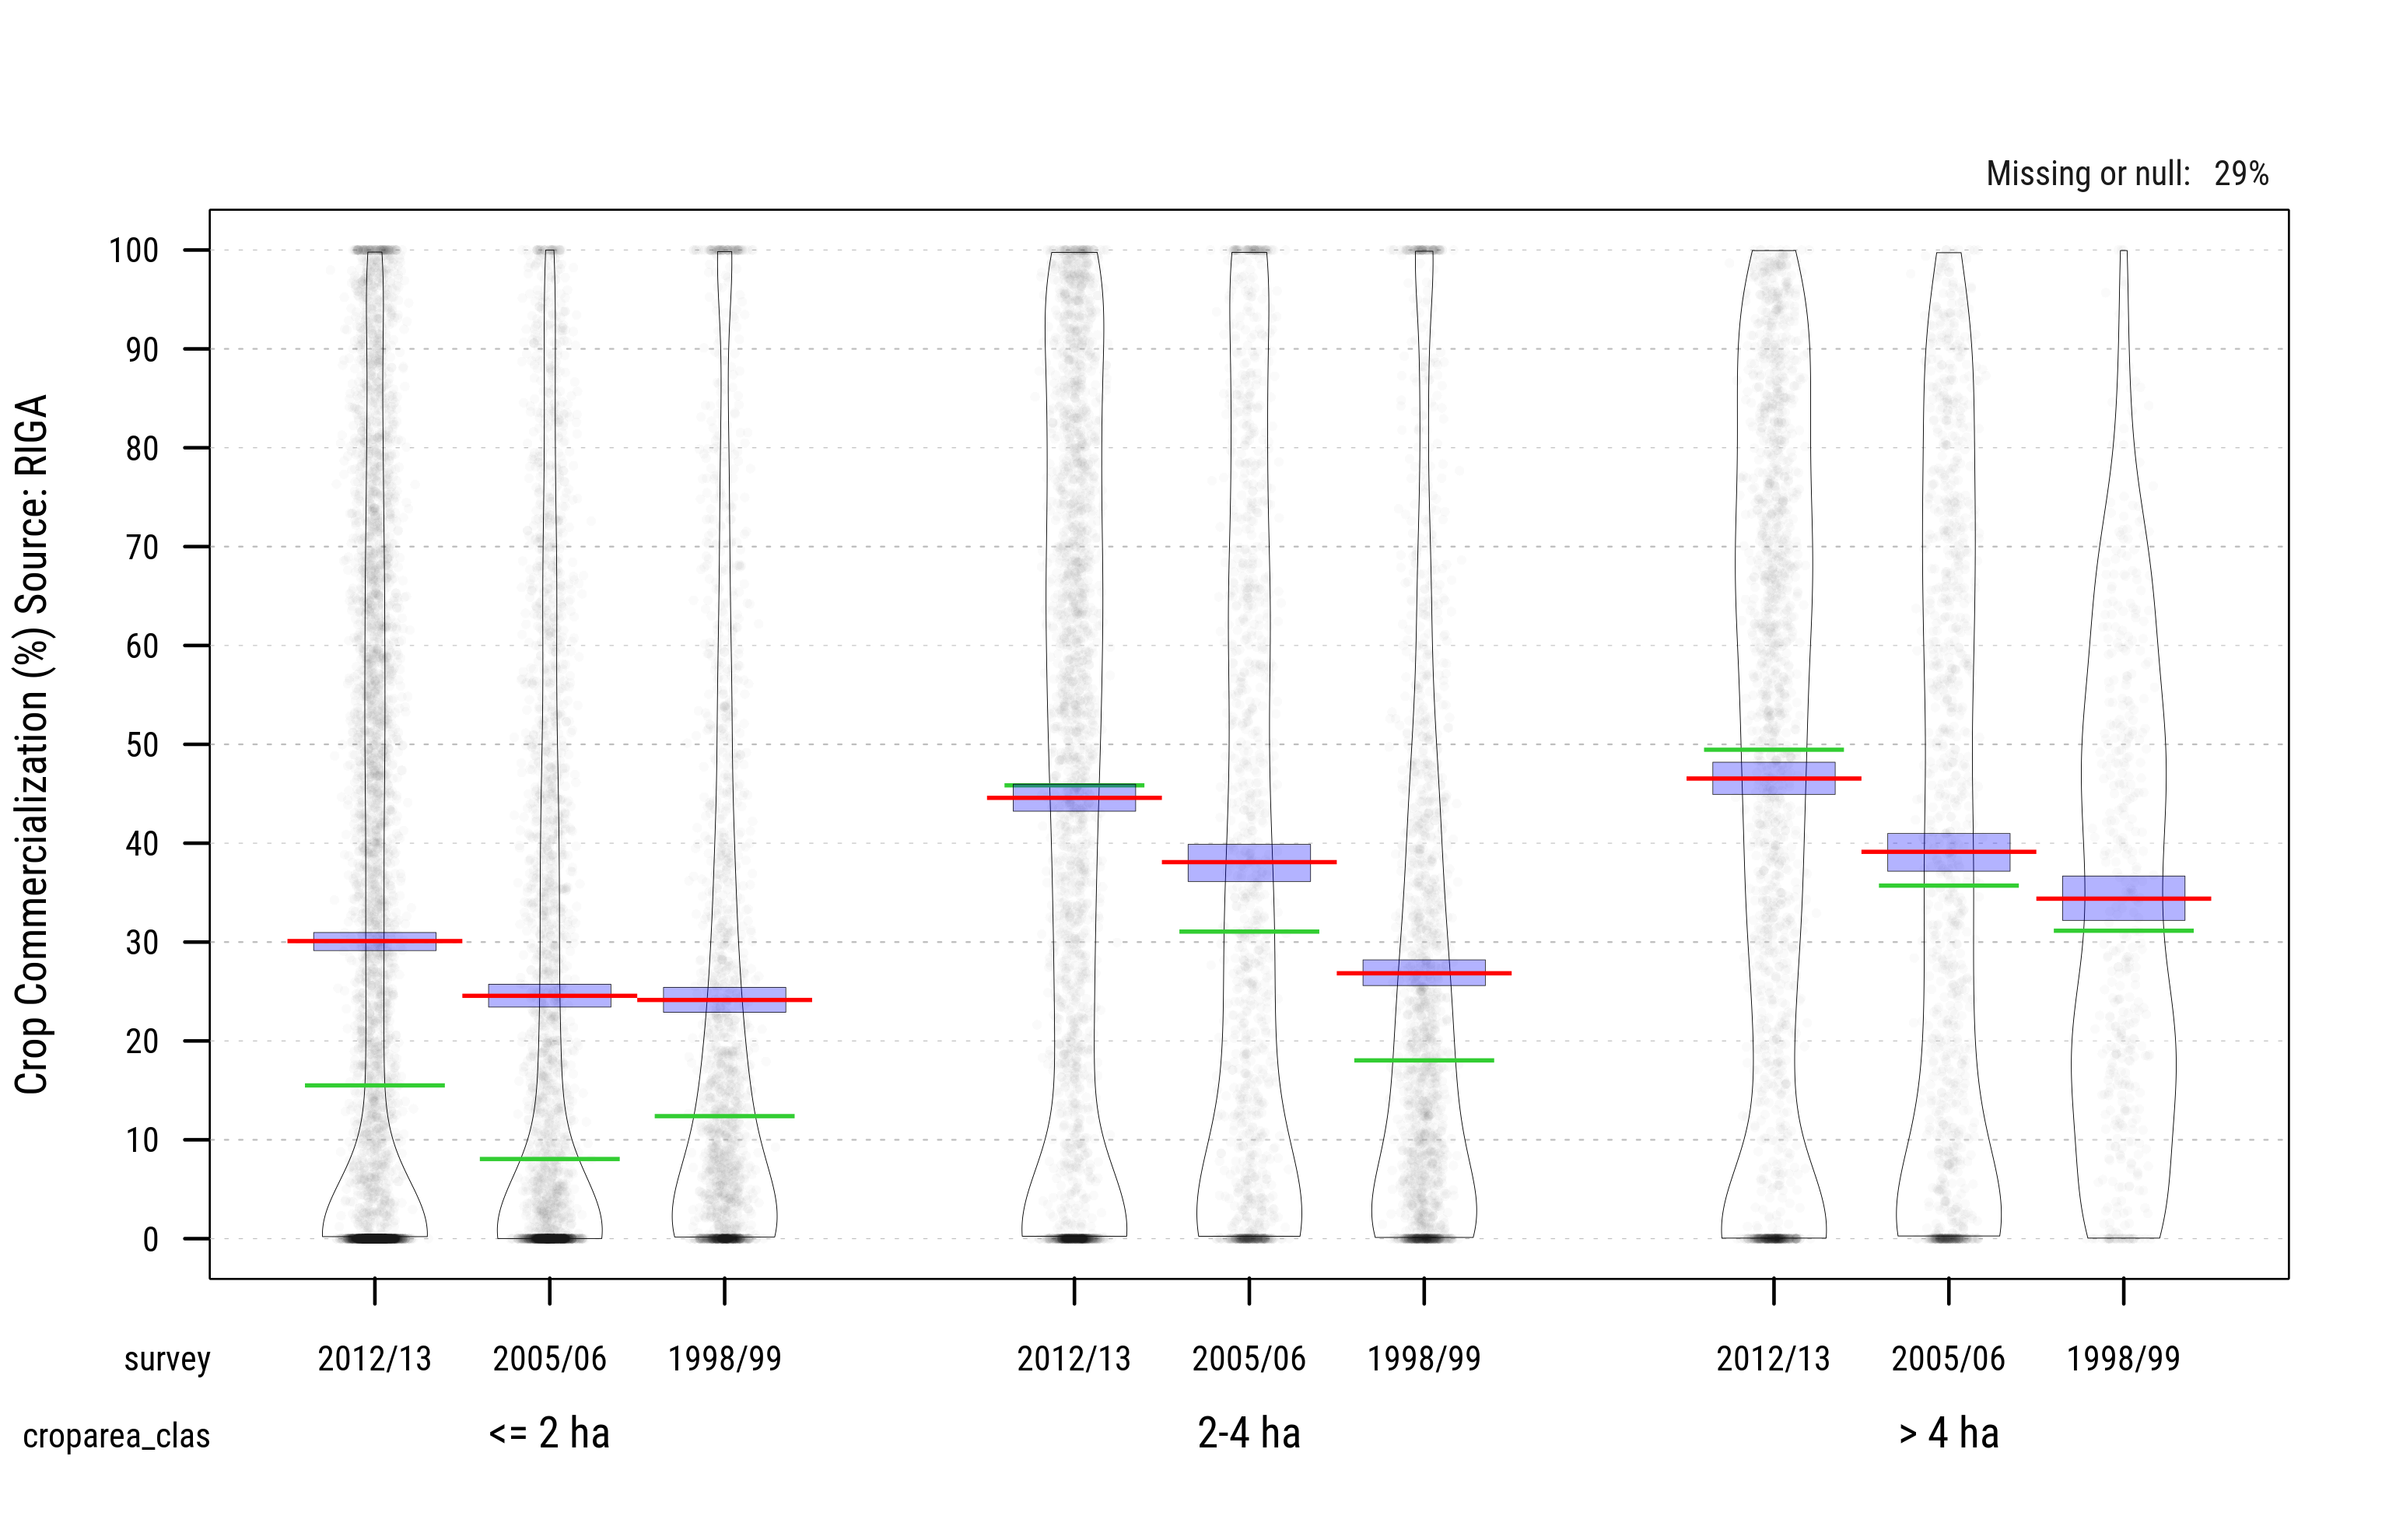
Fig. 3.15: Crop Commercialization in Farms below/above 4ha of Cultivated Area (FAO/RIGA \(shagprodsold\))
3.2.3 Income Diversification
Non-farm income was derived from gross RIGA components as:
\[ naggross=transfersgrossimp+otherincimp+nonfarmrntimp+nonagr\_wge+selfemp \]
\(selfemp\) was imputed to omit negative values. The final distribution of non-farm income in the survey samples is shown below for both rural and urban households
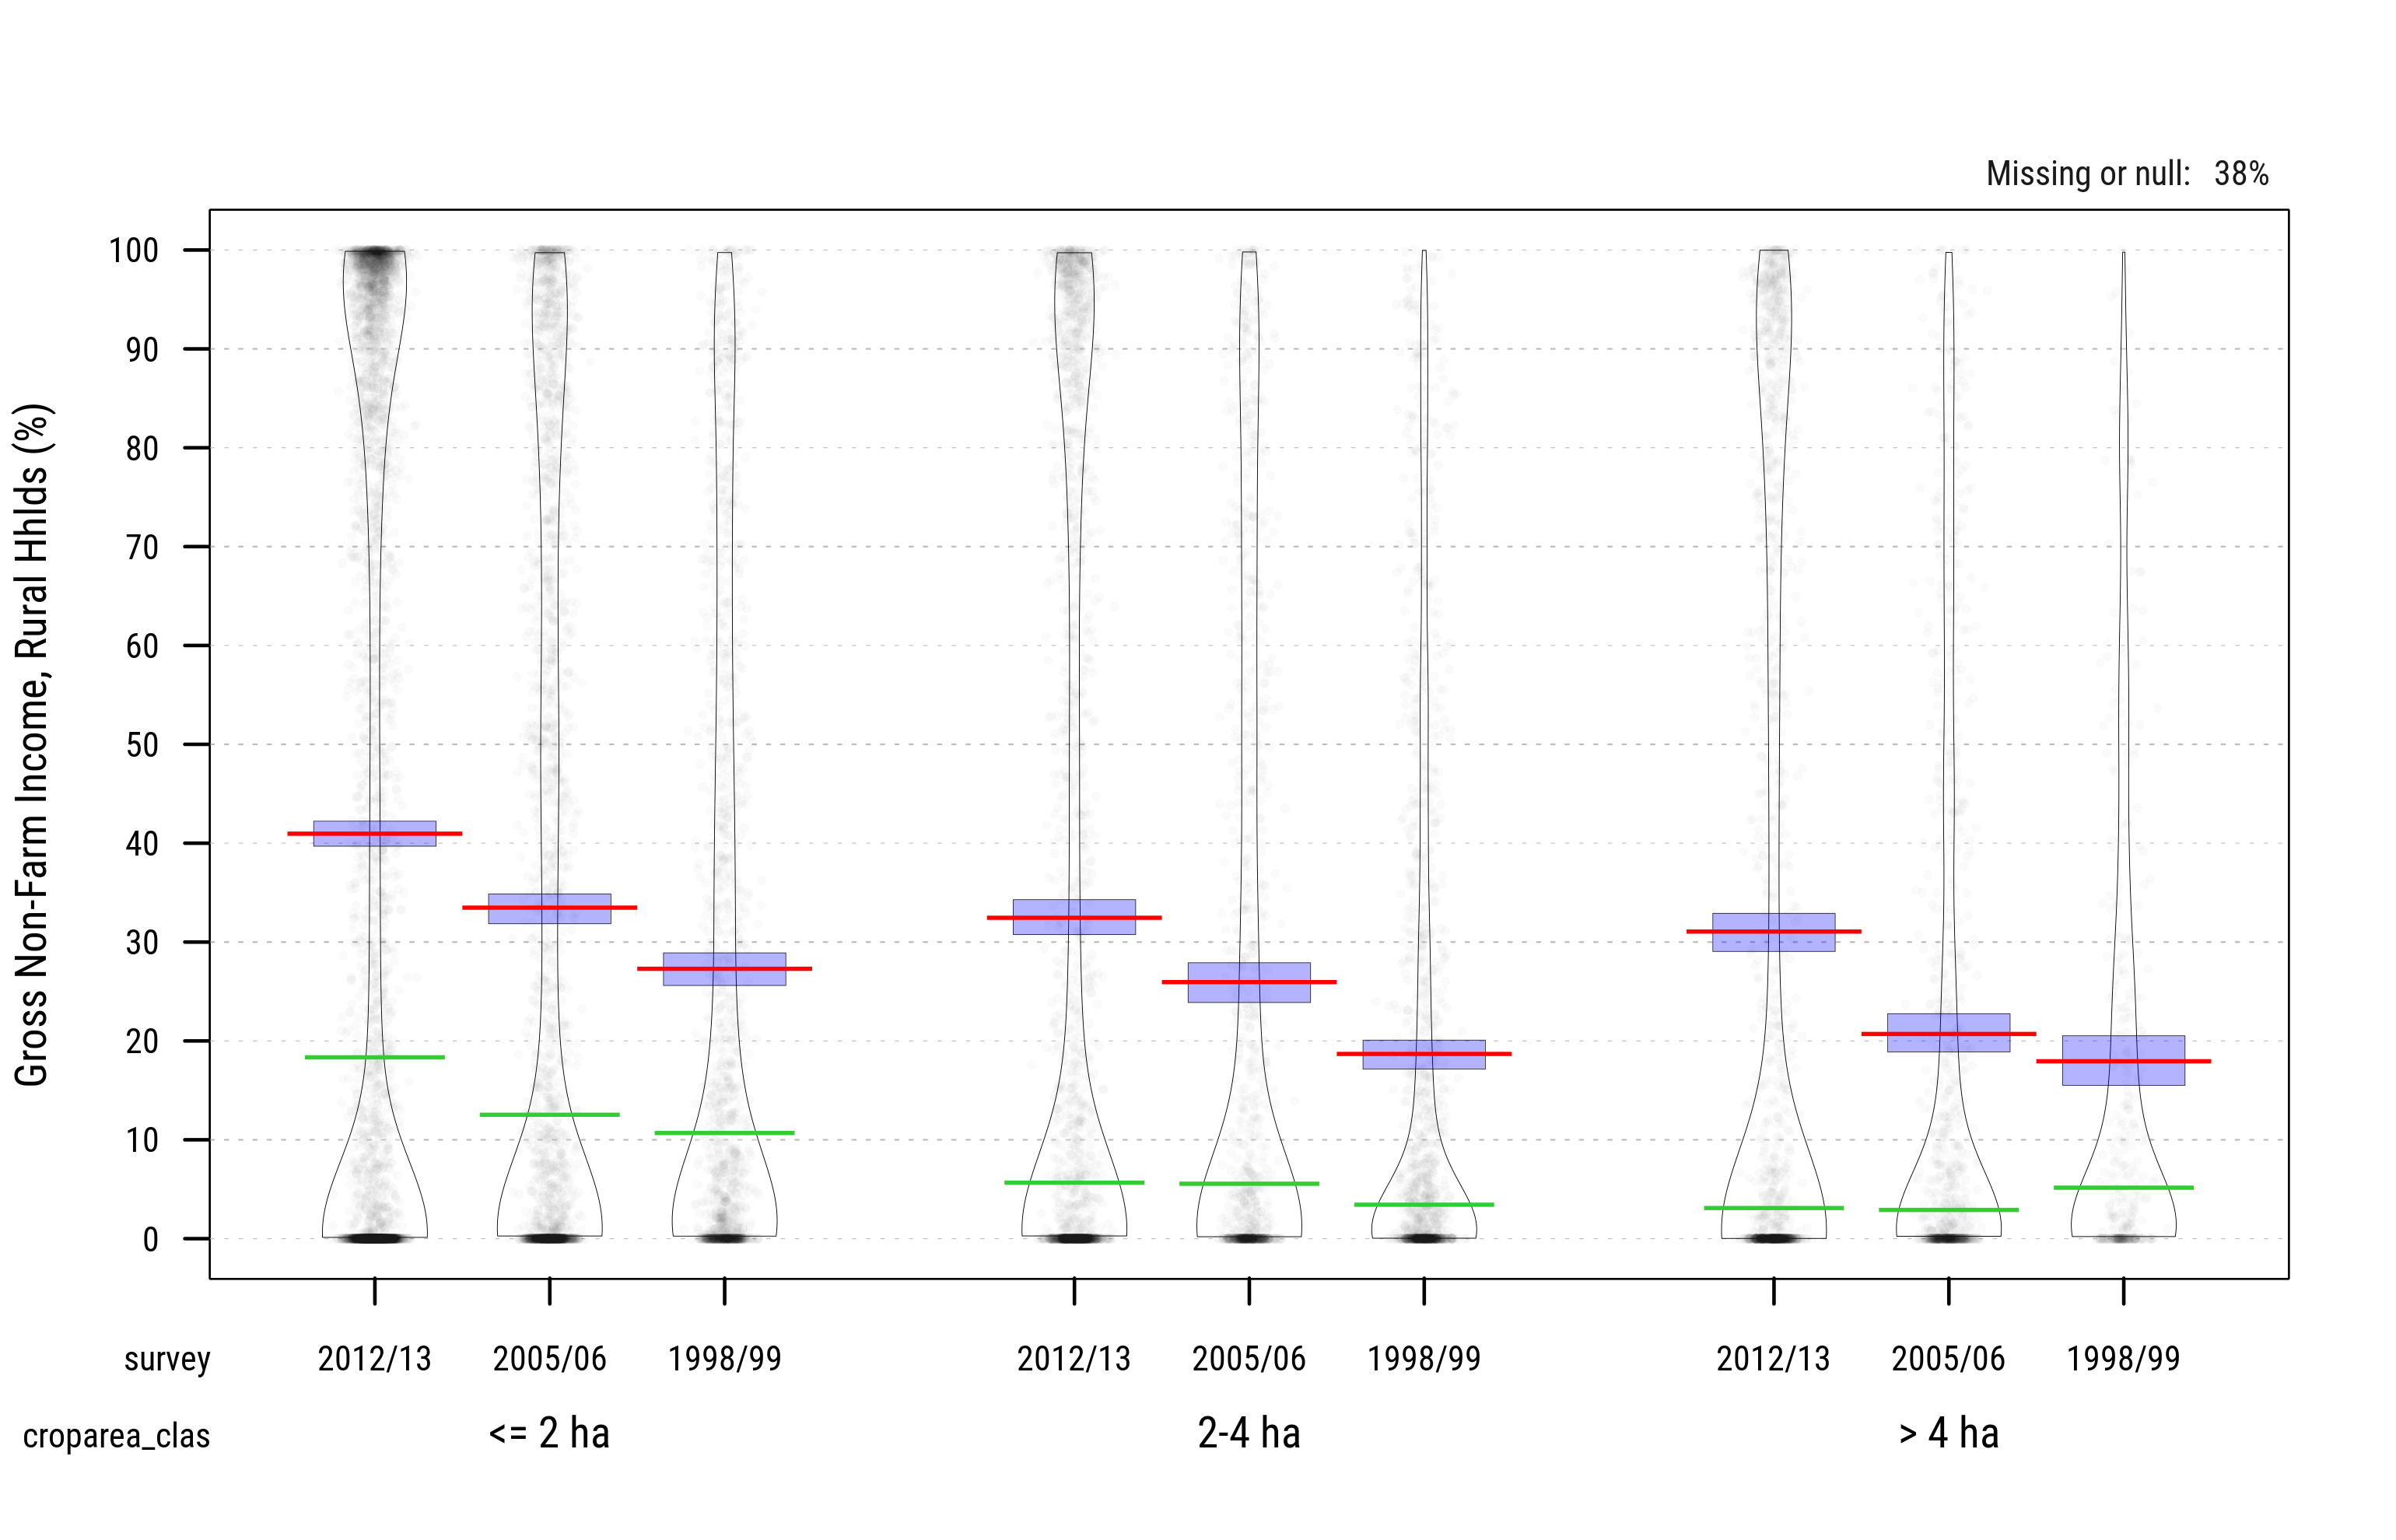
Fig. 3.16: Gross Rural Non-Farm Income across Survey Waves (percent, \(naggrosssh\)) Source: FAO/RIGA
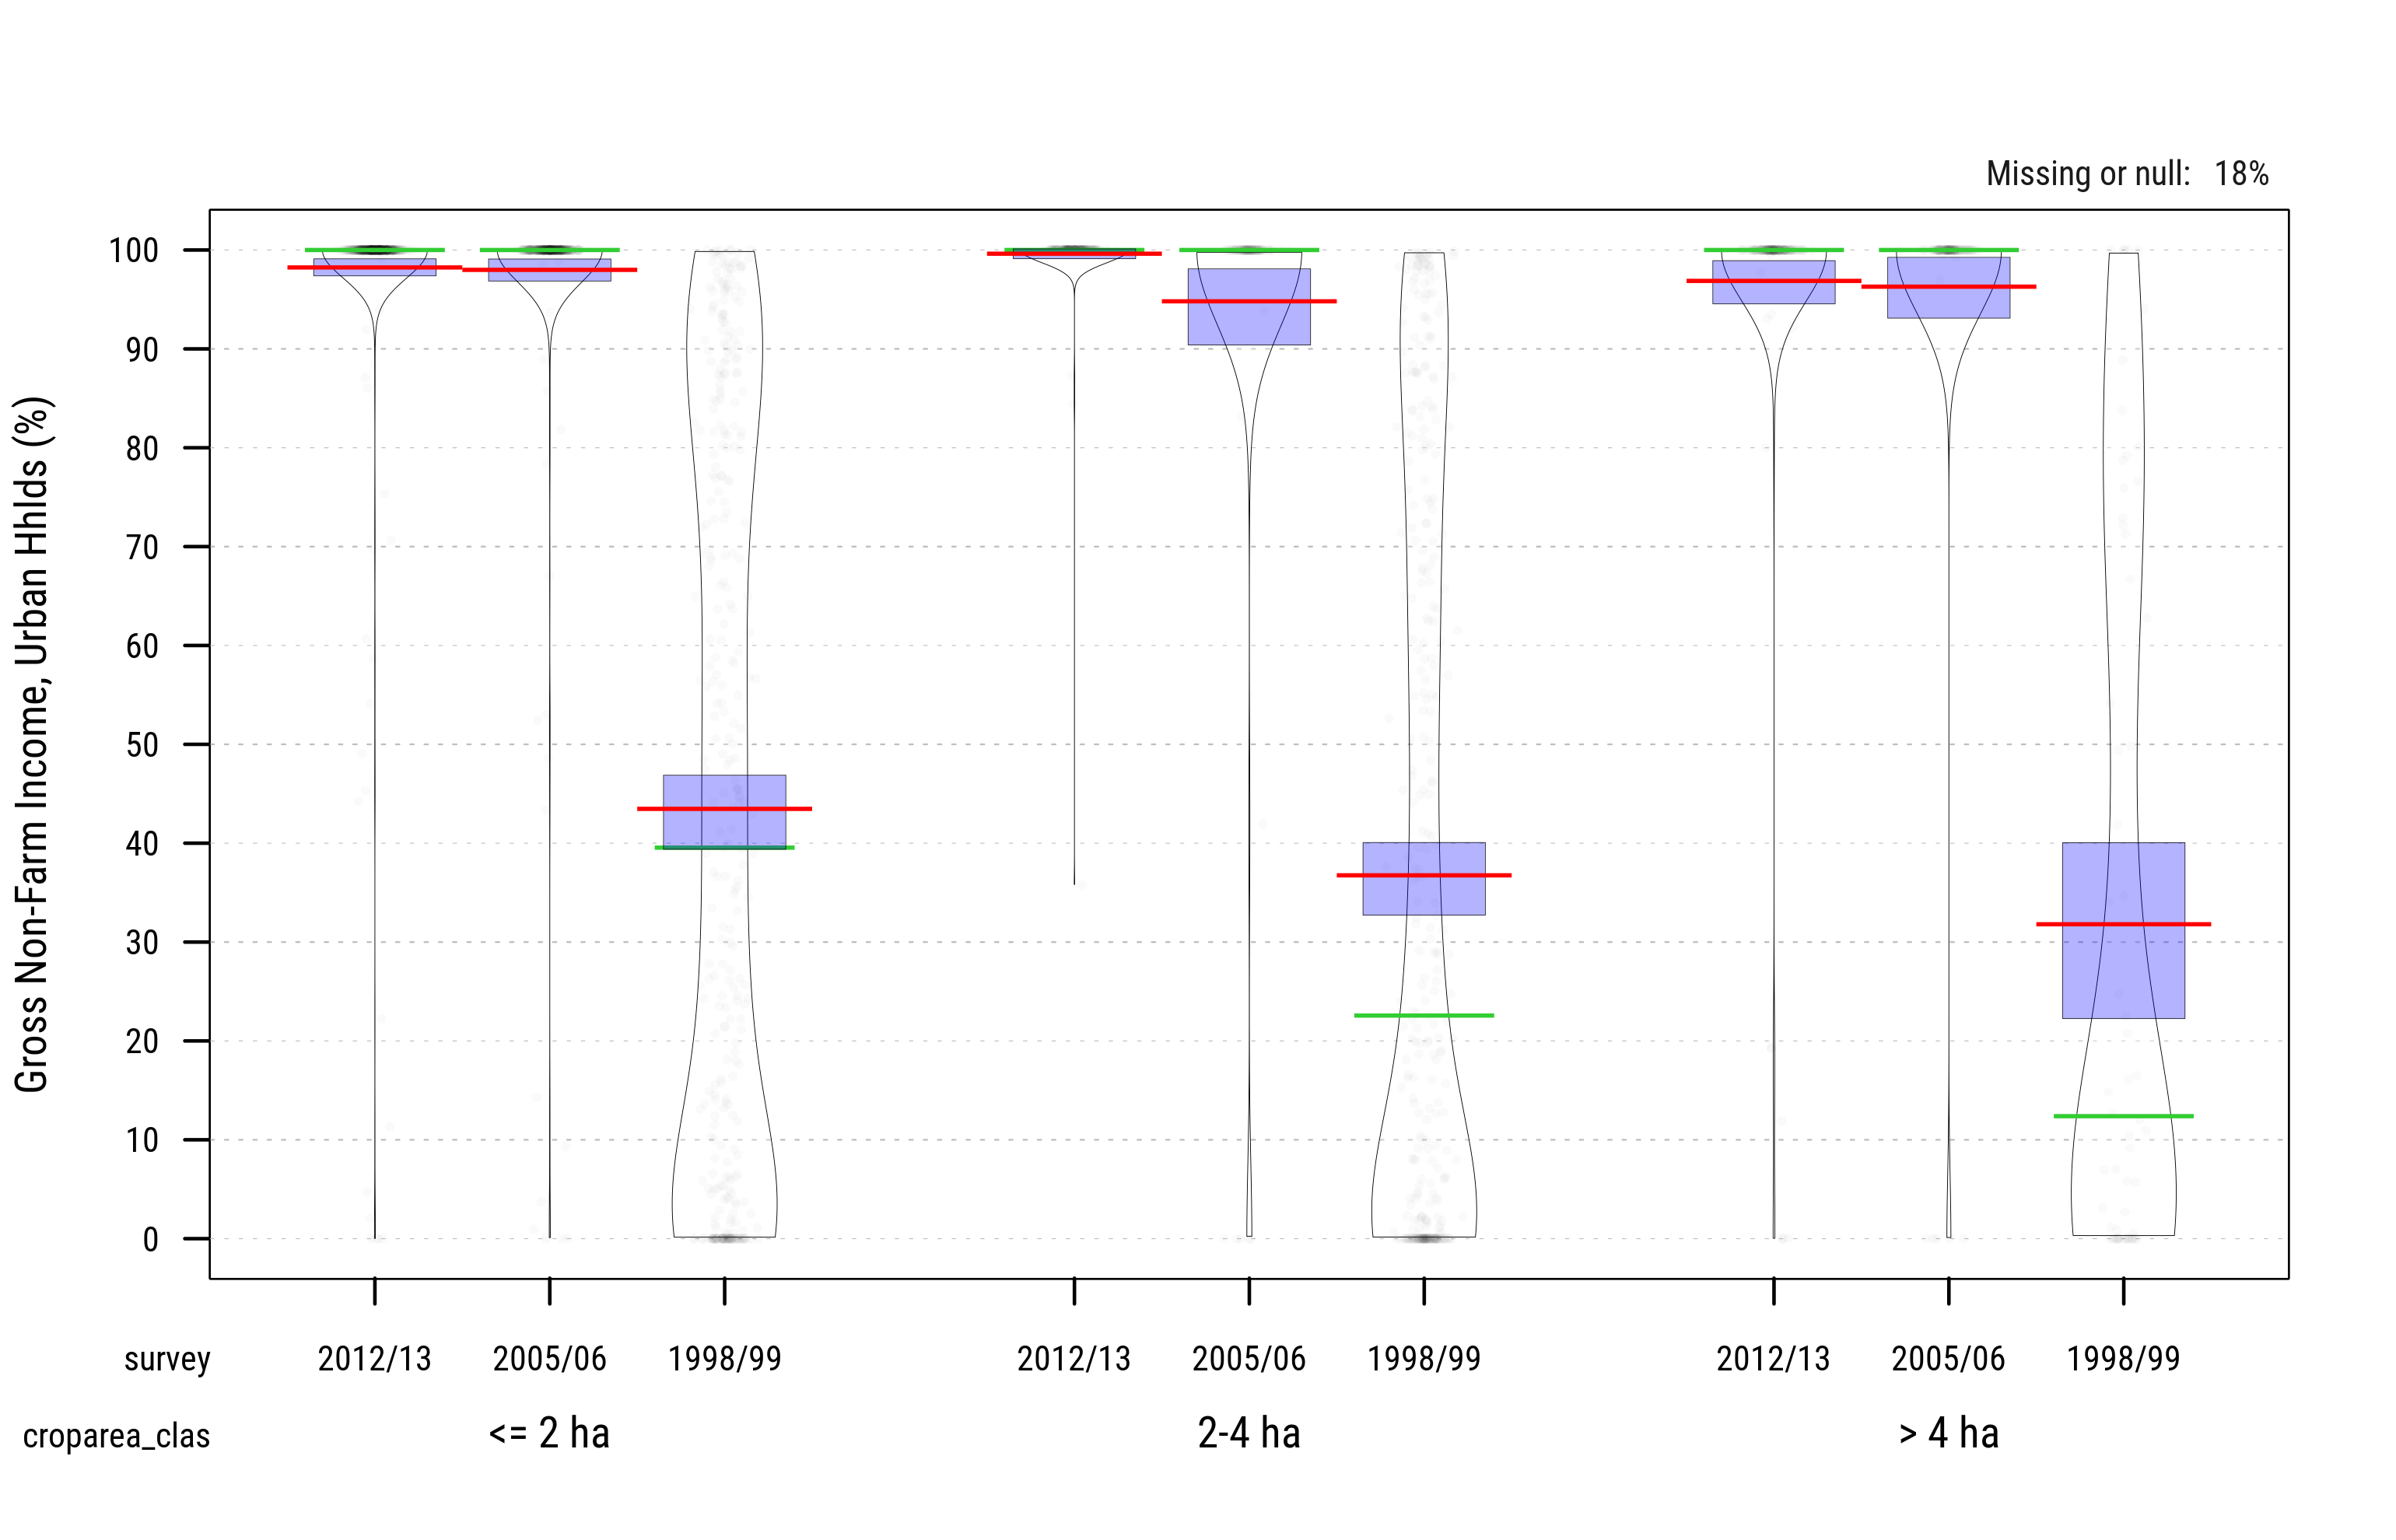
Fig. 3.17: Gross Urban Non-Farm Income across Survey Waves (percent, \(naggrosssh\)) Source: FAO/RIGA
3.2.4 Classification of Small Farm Holdings
Within the sub-sample of farm households we look at the distribution of households across these three key (“threshold”) variables:
- Cultivated/operated area \(cropareaimp\) (using breaks at 2 ha and/or 4 ha and excluding farm households with no \(cropareaimp\))
- Crop commercialization \(cropsales\_sh\) (using breaks at 5% and 50% of crop production)
- Share of off-farm income in total hhld income \(naggross\_sh\) (using breaks at 1/3 and 2/3 of total gross household income)
The tables below show this classification, as proportions of the entire survey samples, and of the selected farm samples.
| \(\leq\) 2 ha | 2-4 ha | \(>\) 4 ha | |||||||||
|---|---|---|---|---|---|---|---|---|---|---|---|
| Wave | LoC | MeC | HiC | LoC | MeC | HiC | LoC | MeC | HiC | All | |
| 2012/13 | LoD | 676 | 795 | 920 | 129 | 450 | 762 | 67 | 331 | 540 | 4,768 |
| MeD | 103 | 110 | 137 | 19 | 63 | 98 | 8 | 46 | 81 | 688 | |
| HiD | 1,335 | 470 | 526 | 357 | 196 | 303 | 236 | 119 | 234 | 9,615 | |
| All | 2,300 | 1,375 | 1,583 | 613 | 709 | 1,163 | 374 | 496 | 855 | 16,772 | |
| 2005/06 | LoD | 430 | 609 | 360 | 126 | 339 | 295 | 91 | 330 | 322 | 2,958 |
| MeD | 87 | 147 | 116 | 24 | 62 | 69 | 11 | 42 | 69 | 646 | |
| HiD | 757 | 184 | 168 | 151 | 65 | 89 | 153 | 43 | 61 | 4,425 | |
| All | 1,377 | 940 | 644 | 330 | 466 | 453 | 285 | 415 | 452 | 8,687 | |
| 1998/99 | LoD | 350 | 573 | 232 | 310 | 755 | 232 | 29 | 205 | 99 | 2,823 |
| MeD | 119 | 135 | 57 | 68 | 117 | 40 | 9 | 30 | 15 | 600 | |
| HiD | 194 | 143 | 56 | 120 | 73 | 53 | 17 | 20 | 11 | 2,228 | |
| All | 669 | 851 | 345 | 499 | 945 | 325 | 55 | 255 | 125 | 5,998 | |
| \(\leq\) 2 ha | 2-4 ha | \(>\) 4 ha | |||||||||
|---|---|---|---|---|---|---|---|---|---|---|---|
| Wave | LoC | MeC | HiC | LoC | MeC | HiC | LoC | MeC | HiC | All | |
| 2012/13 | LoD | 4.0 | 4.7 | 5.5 | 0.8 | 2.7 | 4.5 | 0.4 | 2.0 | 3.2 | 28.4 |
| MeD | 0.6 | 0.7 | 0.8 | 0.1 | 0.4 | 0.6 | 0.0 | 0.3 | 0.5 | 4.1 | |
| HiD | 8.0 | 2.8 | 3.1 | 2.1 | 1.2 | 1.8 | 1.4 | 0.7 | 1.4 | 57.3 | |
| All | 13.7 | 8.2 | 9.4 | 3.7 | 4.2 | 6.9 | 2.2 | 3.0 | 5.1 | 100.0 | |
| 2005/06 | LoD | 4.9 | 7.0 | 4.1 | 1.5 | 3.9 | 3.4 | 1.0 | 3.8 | 3.7 | 34.1 |
| MeD | 1.0 | 1.7 | 1.3 | 0.3 | 0.7 | 0.8 | 0.1 | 0.5 | 0.8 | 7.4 | |
| HiD | 8.7 | 2.1 | 1.9 | 1.7 | 0.7 | 1.0 | 1.8 | 0.5 | 0.7 | 50.9 | |
| All | 15.9 | 10.8 | 7.4 | 3.8 | 5.4 | 5.2 | 3.3 | 4.8 | 5.2 | 100.0 | |
| 1998/99 | LoD | 5.8 | 9.6 | 3.9 | 5.2 | 12.6 | 3.9 | 0.5 | 3.4 | 1.7 | 47.1 |
| MeD | 2.0 | 2.3 | 1.0 | 1.1 | 2.0 | 0.7 | 0.2 | 0.5 | 0.3 | 10.0 | |
| HiD | 3.2 | 2.4 | 0.9 | 2.0 | 1.2 | 0.9 | 0.3 | 0.3 | 0.2 | 37.1 | |
| All | 11.2 | 14.2 | 5.8 | 8.3 | 15.8 | 5.4 | 0.9 | 4.3 | 2.1 | 100.0 | |
| \(\leq\) 2 ha | 2-4 ha | \(>\) 4 ha | |||||||||
|---|---|---|---|---|---|---|---|---|---|---|---|
| Wave | LoC | MeC | HiC | LoC | MeC | HiC | LoC | MeC | HiC | All | |
| 2012/13 | LoD | 7.4 | 8.7 | 10.1 | 1.4 | 4.9 | 8.4 | 0.7 | 3.6 | 5.9 | 51.3 |
| MeD | 1.1 | 1.2 | 1.5 | 0.2 | 0.7 | 1.1 | 0.1 | 0.5 | 0.9 | 7.3 | |
| HiD | 14.7 | 5.2 | 5.8 | 3.9 | 2.2 | 3.3 | 2.6 | 1.3 | 2.6 | 41.4 | |
| All | 23.2 | 15.1 | 17.4 | 5.5 | 7.8 | 12.8 | 3.4 | 5.4 | 9.4 | 100.0 | |
| 2005/06 | LoD | 8.3 | 11.7 | 6.9 | 2.4 | 6.5 | 5.7 | 1.8 | 6.3 | 6.2 | 55.8 |
| MeD | 1.7 | 2.8 | 2.2 | 0.5 | 1.2 | 1.3 | 0.2 | 0.8 | 1.3 | 12.1 | |
| HiD | 14.6 | 3.5 | 3.2 | 2.9 | 1.2 | 1.7 | 2.9 | 0.8 | 1.2 | 32.1 | |
| All | 24.5 | 18.1 | 12.4 | 5.8 | 9.0 | 8.7 | 4.9 | 8.0 | 8.7 | 100.0 | |
| 1998/99 | LoD | 8.6 | 14.1 | 5.7 | 7.6 | 18.6 | 5.7 | 0.7 | 5.0 | 2.4 | 68.6 |
| MeD | 2.9 | 3.3 | 1.4 | 1.7 | 2.9 | 1.0 | 0.2 | 0.7 | 0.4 | 14.5 | |
| HiD | 4.8 | 3.5 | 1.4 | 3.0 | 1.8 | 1.3 | 0.4 | 0.5 | 0.3 | 16.9 | |
| All | 16.3 | 21.0 | 8.5 | 12.3 | 23.3 | 8.0 | 1.4 | 6.3 | 3.1 | 100.0 | |
In the next tables we limit categories to farm households below/above 4ha (as this approach produces classes with larger counts of observations).
| \(\leq\) 4 ha | \(>\) 4 ha | |||||||
|---|---|---|---|---|---|---|---|---|
| Wave | LoC | MeC | HiC | LoC | MeC | HiC | All | |
| 2012/13 | LoD | 805 | 1,245 | 1,682 | 67 | 331 | 540 | 4,768 |
| MeD | 122 | 173 | 235 | 8 | 46 | 81 | 688 | |
| HiD | 1,692 | 666 | 829 | 236 | 119 | 234 | 9,615 | |
| All | 2,913 | 2,084 | 2,746 | 374 | 496 | 855 | 16,772 | |
| 2005/06 | LoD | 556 | 948 | 655 | 91 | 330 | 322 | 2,958 |
| MeD | 111 | 209 | 185 | 11 | 42 | 69 | 646 | |
| HiD | 908 | 249 | 257 | 153 | 43 | 61 | 4,425 | |
| All | 1,707 | 1,406 | 1,097 | 285 | 415 | 452 | 8,687 | |
| 1998/99 | LoD | 660 | 1,328 | 464 | 29 | 205 | 99 | 2,823 |
| MeD | 187 | 252 | 97 | 9 | 30 | 15 | 600 | |
| HiD | 314 | 216 | 109 | 17 | 20 | 11 | 2,228 | |
| All | 1,168 | 1,796 | 670 | 55 | 255 | 125 | 5,998 | |
| \(\leq\) 4 ha | \(>\) 4 ha | |||||||||
|---|---|---|---|---|---|---|---|---|---|---|
| Wave | LoC | MeC | HiC | LoC | MeC | HiC | All | |||
| 2012/13 | LoD | 4.8 | 7.4 | 10.0 | 22.3 | 0.4 | 2.0 | 3.2 | 5.6 | 28.4 |
| MeD | 0.7 | 1.0 | 1.4 | 3.2 | 0.0 | 0.3 | 0.5 | 0.8 | 4.1 | |
| HiD | 10.1 | 4.0 | 4.9 | 19.0 | 1.4 | 0.7 | 1.4 | 3.5 | 57.3 | |
| All | 17.4 | 12.4 | 16.4 | 46.2 | 2.2 | 3.0 | 5.1 | 10.3 | 100.0 | |
| 2005/06 | LoD | 6.4 | 10.9 | 7.5 | 24.9 | 1.0 | 3.8 | 3.7 | 8.6 | 34.1 |
| MeD | 1.3 | 2.4 | 2.1 | 5.8 | 0.1 | 0.5 | 0.8 | 1.4 | 7.4 | |
| HiD | 10.5 | 2.9 | 3.0 | 16.3 | 1.8 | 0.5 | 0.7 | 3.0 | 50.9 | |
| All | 19.7 | 16.2 | 12.6 | 48.5 | 3.3 | 4.8 | 5.2 | 13.3 | 100.0 | |
| 1998/99 | LoD | 11.0 | 22.1 | 7.7 | 40.9 | 0.5 | 3.4 | 1.7 | 5.6 | 47.1 |
| MeD | 3.1 | 4.2 | 1.6 | 8.9 | 0.2 | 0.5 | 0.3 | 0.9 | 10.0 | |
| HiD | 5.2 | 3.6 | 1.8 | 10.7 | 0.3 | 0.3 | 0.2 | 0.8 | 37.1 | |
| All | 19.5 | 29.9 | 11.2 | 60.6 | 0.9 | 4.3 | 2.1 | 7.3 | 100.0 | |
| \(\leq\) 4 ha | \(>\) 4 ha | |||||||||
|---|---|---|---|---|---|---|---|---|---|---|
| Wave | LoC | MeC | HiC | LoC | MeC | HiC | All | |||
| 2012/13 | LoD | 8.8 | 13.7 | 18.5 | 41.0 | 0.7 | 3.6 | 5.9 | 10.3 | 51.3 |
| MeD | 1.3 | 1.9 | 2.6 | 5.8 | 0.1 | 0.5 | 0.9 | 1.5 | 7.3 | |
| HiD | 18.6 | 7.3 | 9.1 | 35.0 | 2.6 | 1.3 | 2.6 | 6.5 | 41.4 | |
| All | 28.7 | 22.9 | 30.1 | 81.8 | 3.4 | 5.4 | 9.4 | 18.2 | 100.0 | |
| 2005/06 | LoD | 10.7 | 18.2 | 12.6 | 41.5 | 1.8 | 6.3 | 6.2 | 14.3 | 55.8 |
| MeD | 2.1 | 4.0 | 3.6 | 9.7 | 0.2 | 0.8 | 1.3 | 2.3 | 12.1 | |
| HiD | 17.5 | 4.8 | 4.9 | 27.2 | 2.9 | 0.8 | 1.2 | 4.9 | 32.1 | |
| All | 30.3 | 27.0 | 21.1 | 78.4 | 4.9 | 8.0 | 8.7 | 21.6 | 100.0 | |
| 1998/99 | LoD | 16.2 | 32.7 | 11.4 | 60.4 | 0.7 | 5.0 | 2.4 | 8.2 | 68.6 |
| MeD | 4.6 | 6.2 | 2.4 | 13.2 | 0.2 | 0.7 | 0.4 | 1.3 | 14.5 | |
| HiD | 7.7 | 5.3 | 2.7 | 15.7 | 0.4 | 0.5 | 0.3 | 1.2 | 16.9 | |
| All | 28.6 | 44.2 | 16.5 | 89.3 | 1.4 | 6.3 | 3.1 | 10.7 | 100.0 | |
Using data from the 3 GLSS waves we estimate the proportions of farm households across all categories and the distributions of other key household characteristics (household structure, assets, farm input uses, etc.).
Estimated proportions of farm households across classes and categories are shown in the next graph and table.
3.2.5 Key Results

Fig. 3.18: Est. Proportions of Farm Holdings across Cultivated Area and Categories
| Crop Commercialization | ||||
|---|---|---|---|---|
| Income Diversification | LoC | MeC | HiC | |
| LoD | mean | 8.1 | 14.5 | 22.6 |
| CI | 7.0 - 9.2 | 12.9 - 16.1 | 20.5 - 24.7 | |
| MeD | mean | 1.4 | 1.8 | 3.4 |
| CI | 1.1 - 1.8 | 1.4 - 2.2 | 2.8 - 4.0 | |
| HiD | mean | 27.0 | 8.7 | 12.5 |
| CI | 24.2 - 29.8 | 7.3 - 10.1 | 11.0 - 13.9 | |
| LoCLoD | LoCMeD | LoCHiD | MeCLoD | MeCMeD | MeCHiD | HiCLoD | HiCMeD | HiCHiD | |||||||||||
|---|---|---|---|---|---|---|---|---|---|---|---|---|---|---|---|---|---|---|---|
| Variable | est. | std. err. | est. | std. err. | est. | std. err. | est. | std. err. | est. | std. err. | est. | std. err. | est. | std. err. | est. | std. err. | est. | std. err. | |
| hhsize_imp | Mean | 4.2 | 0.1 | 3.6 | 0.2 | 4.3 | 0.1 | 4.8 | 0.1 | 4.5 | 0.2 | 5.2 | 0.2 | 4.3 | 0.1 | 3.9 | 0.2 | 4.6 | 0.1 |
| Q50 | 4.0 | 0.0 | 3.0 | 0.3 | 4.0 | 0.0 | 4.0 | 0.3 | 4.0 | 0.5 | 5.0 | 0.0 | 4.0 | 0.0 | 4.0 | 0.3 | 4.0 | 0.3 | |
| agehead | Mean | 49.6 | 0.7 | 54.1 | 2.4 | 48.8 | 0.5 | 47.0 | 0.6 | 51.4 | 1.9 | 47.8 | 0.9 | 47.4 | 0.5 | 52.4 | 1.5 | 46.9 | 0.8 |
| Q50 | 48.0 | 1.3 | 55.0 | 2.6 | 47.0 | 0.8 | 45.0 | 1.0 | 50.0 | 2.3 | 46.0 | 1.3 | 45.0 | 0.5 | 50.0 | 2.0 | 45.0 | 1.0 | |
| (100 * femhead) | Mean | 30.1 | 2.2 | 56.9 | 6.3 | 33.6 | 1.7 | 20.9 | 1.7 | 42.9 | 5.5 | 27.6 | 2.3 | 20.7 | 1.5 | 27.2 | 4.1 | 26.0 | 2.3 |
| Q50 | 0.0 | 0.0 | 100.0 | 0.0 | 0.0 | 0.0 | 0.0 | 0.0 | 0.0 | 25.5 | 0.0 | 0.0 | 0.0 | 0.0 | 0.0 | 0.0 | 0.0 | 0.0 | |
| (100 * widowhead) | Mean | 6.4 | 1.4 | 19.5 | 6.2 | 6.1 | 1.0 | 5.6 | 1.1 | 10.6 | 3.5 | 4.4 | 1.1 | 3.8 | 0.7 | 8.8 | 2.7 | 3.6 | 1.0 |
| Q50 | 0.0 | 0.0 | 0.0 | 0.0 | 0.0 | 0.0 | 0.0 | 0.0 | 0.0 | 0.0 | 0.0 | 0.0 | 0.0 | 0.0 | 0.0 | 0.0 | 0.0 | 0.0 | |
| hhlabor | Mean | 2.1 | 0.1 | 1.6 | 0.1 | 2.3 | 0.1 | 2.3 | 0.1 | 2.1 | 0.1 | 2.6 | 0.1 | 2.1 | 0.1 | 1.9 | 0.1 | 2.3 | 0.1 |
| Q50 | 2.0 | 0.0 | 1.0 | 0.3 | 2.0 | 0.0 | 2.0 | 0.0 | 2.0 | 0.0 | 2.0 | 0.0 | 2.0 | 0.0 | 2.0 | 0.1 | 2.0 | 0.0 | |
| educhead | Mean | 3.1 | 0.2 | 4.3 | 0.4 | 6.0 | 0.2 | 3.6 | 0.2 | 3.1 | 0.4 | 5.3 | 0.2 | 4.1 | 0.1 | 5.0 | 0.4 | 6.0 | 0.2 |
| Q50 | 0.0 | 0.0 | 3.7 | 1.5 | 6.0 | 0.3 | 2.0 | 1.0 | 0.0 | 0.8 | 6.0 | 0.0 | 5.0 | 0.5 | 6.0 | 0.5 | 6.0 | 0.3 | |
| educave15_60 | Mean | 3.8 | 0.2 | 4.9 | 0.4 | 6.1 | 0.1 | 3.8 | 0.1 | 4.1 | 0.3 | 5.3 | 0.2 | 4.3 | 0.1 | 5.6 | 0.3 | 5.8 | 0.1 |
| Q50 | 3.5 | 0.4 | 5.8 | 0.4 | 6.0 | 0.1 | 3.9 | 0.3 | 4.0 | 0.5 | 6.0 | 0.2 | 4.5 | 0.2 | 6.0 | 0.2 | 6.0 | 0.0 | |
| educhigh | Mean | 5.3 | 0.2 | 6.4 | 0.3 | 7.6 | 0.1 | 5.5 | 0.1 | 5.7 | 0.3 | 7.1 | 0.2 | 5.8 | 0.1 | 6.6 | 0.3 | 7.5 | 0.1 |
| Q50 | 6.0 | 0.0 | 7.0 | 0.3 | 8.0 | 0.5 | 6.0 | 0.0 | 6.0 | 0.0 | 7.0 | 0.3 | 6.0 | 0.0 | 7.0 | 0.5 | 8.0 | 0.5 | |
| (100 * ownhome) | Mean | 74.5 | 3.2 | 72.3 | 4.7 | 48.1 | 1.9 | 71.9 | 2.0 | 66.0 | 5.6 | 62.7 | 4.3 | 70.2 | 1.7 | 67.5 | 4.4 | 57.9 | 2.7 |
| Q50 | 100.0 | 0.0 | 100.0 | 0.0 | 0.0 | 25.5 | 100.0 | 0.0 | 100.0 | 0.0 | 100.0 | 0.0 | 100.0 | 0.0 | 100.0 | 0.0 | 100.0 | 0.0 | |
| (100 * cellphone) | Mean | 22.8 | 2.2 | 23.1 | 5.9 | 11.4 | 1.4 | 20.4 | 2.1 | 16.5 | 3.5 | 15.7 | 2.1 | 18.2 | 2.1 | 18.0 | 3.4 | 13.7 | 1.8 |
| Q50 | 0.0 | 0.0 | 0.0 | 0.0 | 0.0 | 0.0 | 0.0 | 0.0 | 0.0 | 0.0 | 0.0 | 0.0 | 0.0 | 0.0 | 0.0 | 0.0 | 0.0 | 0.0 | |
| (100 * telephone) | Mean | 0.0 | 0.0 | 0.0 | 0.0 | 0.6 | 0.2 | 0.3 | 0.2 | 0.0 | 0.0 | 0.5 | 0.3 | 0.3 | 0.1 | 0.0 | 0.0 | 0.6 | 0.3 |
| Q50 | 0.0 | 0.0 | 0.0 | 0.0 | 0.0 | 0.0 | 0.0 | 0.0 | 0.0 | 0.0 | 0.0 | 0.0 | 0.0 | 0.0 | 0.0 | 0.0 | 0.0 | 0.0 | |
| (100 * electricity) | Mean | 29.3 | 3.2 | 42.8 | 6.4 | 73.8 | 1.6 | 29.8 | 3.1 | 41.8 | 5.0 | 49.9 | 3.3 | 34.3 | 2.7 | 55.1 | 4.7 | 60.7 | 3.2 |
| Q50 | 0.0 | 0.0 | 0.0 | 25.5 | 100.0 | 0.0 | 0.0 | 0.0 | 0.0 | 25.5 | 0.0 | 25.5 | 0.0 | 0.0 | 100.0 | 0.0 | 100.0 | 0.0 | |
| distwater | Mean | 0.6 | 0.2 | 0.3 | 0.1 | 1.6 | 0.6 | 1.2 | 0.3 | 1.4 | 0.7 | 3.5 | 1.2 | 3.7 | 1.9 | 3.5 | 2.7 | 1.4 | 0.6 |
| Q50 | 0.2 | 0.0 | 0.1 | 0.0 | 0.1 | 0.0 | 0.2 | 0.0 | 0.1 | 0.0 | 0.1 | 0.0 | 0.1 | 0.0 | 0.1 | 0.0 | 0.1 | 0.0 | |
| distroad | Mean | 1.6 | 0.4 | 0.4 | 0.2 | 0.2 | 0.1 | 1.2 | 0.3 | 0.4 | 0.1 | 0.4 | 0.1 | 0.9 | 0.2 | 0.3 | 0.1 | 0.3 | 0.1 |
| Q50 | 0.0 | 0.0 | 0.0 | 0.0 | 0.0 | 0.0 | 0.0 | 0.0 | 0.0 | 0.0 | 0.0 | 0.0 | 0.0 | 0.0 | 0.0 | 0.0 | 0.0 | 0.0 | |
| distpost | Mean | 16.0 | 1.1 | 14.8 | 1.5 | 11.5 | 0.9 | 18.6 | 1.2 | 15.4 | 1.6 | 13.5 | 1.2 | 18.3 | 1.3 | 15.3 | 1.4 | 13.7 | 0.9 |
| Q50 | 11.0 | 0.5 | 12.0 | 1.7 | 8.0 | 1.0 | 14.0 | 0.9 | 10.0 | 1.0 | 9.0 | 1.0 | 14.0 | 1.0 | 11.0 | 1.4 | 10.0 | 1.0 | |
| distbank | Mean | 13.2 | 1.0 | 12.4 | 1.1 | 8.1 | 0.6 | 16.1 | 1.0 | 14.7 | 1.5 | 11.2 | 0.9 | 15.4 | 1.0 | 12.2 | 1.0 | 11.1 | 0.7 |
| Q50 | 10.0 | 0.8 | 10.0 | 1.0 | 5.0 | 0.5 | 12.0 | 1.0 | 10.0 | 1.0 | 8.0 | 1.0 | 11.0 | 1.0 | 10.0 | 1.0 | 8.0 | 0.8 | |
| disthealth | Mean | 18.2 | 1.2 | 17.8 | 1.6 | 14.4 | 1.1 | 20.8 | 1.2 | 18.2 | 1.6 | 16.5 | 1.4 | 21.0 | 1.1 | 18.7 | 1.4 | 17.9 | 1.0 |
| Q50 | 12.0 | 1.3 | 15.0 | 2.6 | 10.0 | 1.3 | 15.0 | 1.0 | 12.0 | 1.9 | 11.7 | 1.5 | 17.0 | 0.8 | 15.0 | 1.8 | 14.0 | 1.0 | |
| LoCLoD | LoCMeD | LoCHiD | MeCLoD | MeCMeD | MeCHiD | HiCLoD | HiCMeD | HiCHiD | |||||||||||
|---|---|---|---|---|---|---|---|---|---|---|---|---|---|---|---|---|---|---|---|
| Variable | est. | std. err. | est. | std. err. | est. | std. err. | est. | std. err. | est. | std. err. | est. | std. err. | est. | std. err. | est. | std. err. | est. | std. err. | |
| landown | Mean | 0.8 | 0.1 | 0.6 | 0.1 | 1.0 | 0.1 | 1.1 | 0.1 | 1.1 | 0.1 | 0.9 | 0.1 | 1.3 | 0.1 | 1.3 | 0.1 | 1.1 | 0.1 |
| Q50 | 0.5 | 0.1 | 0.4 | 0.1 | 0.8 | 0.1 | 0.8 | 0.1 | 0.8 | 0.2 | 0.8 | 0.1 | 1.2 | 0.1 | 1.2 | 0.2 | 0.8 | 0.1 | |
| landshare | Mean | 0.4 | 0.1 | 0.2 | 0.1 | 0.9 | 0.1 | 0.7 | 0.1 | 0.3 | 0.1 | 0.7 | 0.1 | 0.7 | 0.1 | 0.7 | 0.2 | 0.7 | 0.1 |
| Q50 | 0.4 | 0.3 | 0.1 | 0.2 | 0.8 | 0.0 | 0.4 | 0.2 | 0.2 | 0.1 | 0.7 | 0.2 | 0.4 | 0.1 | 0.4 | 0.3 | 0.8 | 0.1 | |
| croparea_imp | Mean | 1.0 | 0.0 | 0.8 | 0.1 | 1.1 | 0.1 | 1.5 | 0.0 | 1.4 | 0.1 | 1.3 | 0.1 | 1.7 | 0.0 | 1.7 | 0.1 | 1.4 | 0.1 |
| Q50 | 0.8 | 0.0 | 0.6 | 0.1 | 0.8 | 0.0 | 1.3 | 0.1 | 1.2 | 0.2 | 1.2 | 0.1 | 1.6 | 0.0 | 1.6 | 0.1 | 1.2 | 0.1 | |
| LoCLoD | LoCMeD | LoCHiD | MeCLoD | MeCMeD | MeCHiD | HiCLoD | HiCMeD | HiCHiD | |||||||||||
|---|---|---|---|---|---|---|---|---|---|---|---|---|---|---|---|---|---|---|---|
| Variable | est. | std. err. | est. | std. err. | est. | std. err. | est. | std. err. | est. | std. err. | est. | std. err. | est. | std. err. | est. | std. err. | est. | std. err. | |
| aggross | Mean | 764.30 | 91.89 | 867.16 | 267.01 | 109.18 | 15.01 | 1,480.59 | 156.33 | 1,001.94 | 105.61 | 915.36 | 75.76 | 2,051.20 | 94.36 | 2,165.55 | 279.43 | 1,421.15 | 116.28 |
| Q50 | 322.59 | 32.34 | 364.87 | 54.64 | 0.00 | 0.00 | 906.75 | 50.29 | 589.54 | 105.38 | 584.03 | 84.87 | 1,446.06 | 80.14 | 1,171.40 | 99.60 | 892.04 | 97.64 | |
| totgross | Mean | 799.08 | 95.35 | 1,840.20 | 680.38 | 33,148.29 | 3,004.92 | 1,532.24 | 158.06 | 1,962.72 | 198.77 | 33,976.45 | 3,676.22 | 2,157.56 | 98.99 | 4,609.96 | 636.60 | 41,257.51 | 2,760.21 |
| Q50 | 330.23 | 32.57 | 691.35 | 105.52 | 8,451.82 | 762.28 | 934.65 | 47.01 | 1,148.38 | 175.96 | 14,134.41 | 1,501.61 | 1,511.40 | 88.77 | 2,341.20 | 250.19 | 17,071.37 | 1,510.50 | |
| (100 * naggross_sh) | Mean | 2.24 | 0.33 | 48.18 | 1.20 | 98.31 | 0.17 | 3.32 | 0.31 | 48.00 | 0.90 | 91.04 | 0.50 | 3.96 | 0.28 | 49.47 | 0.74 | 91.33 | 0.42 |
| Q50 | 0.00 | 0.00 | 45.54 | 2.46 | 100.00 | 0.00 | 0.00 | 0.00 | 46.81 | 1.87 | 95.11 | 0.87 | 0.00 | 0.00 | 49.02 | 1.59 | 95.12 | 0.57 | |
| cropvalue | Mean | 572.90 | 81.55 | 447.44 | 49.53 | 227.41 | 30.05 | 1,349.28 | 154.45 | 853.43 | 87.45 | 831.14 | 70.41 | 1,680.17 | 66.75 | 1,479.35 | 114.63 | 1,045.24 | 64.32 |
| Q50 | 265.33 | 26.33 | 320.46 | 57.85 | 82.08 | 14.28 | 813.72 | 53.96 | 536.90 | 86.16 | 532.68 | 75.77 | 1,187.46 | 62.01 | 1,000.32 | 83.87 | 662.61 | 79.28 | |
| cropsales | Mean | 5.02 | 2.21 | 3.65 | 1.28 | 0.71 | 0.23 | 341.55 | 22.78 | 215.81 | 34.40 | 211.96 | 18.26 | 1,273.75 | 54.35 | 1,136.31 | 93.45 | 797.40 | 54.54 |
| Q50 | 0.00 | 0.00 | 0.00 | 0.00 | 0.00 | 0.00 | 200.00 | 16.58 | 120.00 | 13.00 | 112.07 | 8.74 | 880.00 | 53.12 | 792.72 | 82.31 | 426.00 | 72.99 | |
| (100 * cropsales_sh) | Mean | 0.30 | 0.05 | 0.47 | 0.11 | 0.07 | 0.01 | 29.57 | 0.59 | 29.26 | 1.19 | 28.12 | 0.85 | 76.60 | 0.72 | 76.80 | 1.24 | 79.13 | 0.89 |
| Q50 | 0.00 | 0.00 | 0.00 | 0.00 | 0.00 | 0.00 | 30.40 | 1.01 | 30.71 | 2.23 | 28.84 | 1.13 | 76.94 | 1.25 | 78.19 | 2.51 | 80.11 | 1.52 | |
| totlvstprod | Mean | 14.64 | 2.84 | 8.25 | 2.93 | 5.90 | 1.02 | 77.76 | 5.66 | 67.05 | 9.58 | 54.62 | 6.28 | 300.83 | 74.86 | 609.61 | 239.93 | 336.41 | 94.84 |
| Q50 | 0.00 | 0.00 | 0.00 | 0.00 | 0.00 | 0.00 | 16.16 | 4.34 | 16.94 | 9.90 | 10.00 | 5.50 | 3.70 | 4.08 | 5.00 | 10.20 | 5.00 | 5.10 | |
| totlivsold | Mean | 1.86 | 0.64 | 1.43 | 0.70 | 0.61 | 0.18 | 60.00 | 4.86 | 52.12 | 8.52 | 39.56 | 4.97 | 287.82 | 74.08 | 592.38 | 238.63 | 326.79 | 94.63 |
| Q50 | 0.00 | 0.00 | 0.00 | 0.00 | 0.00 | 0.00 | 0.00 | 0.00 | 0.00 | 4.99 | 0.00 | 0.00 | 0.00 | 0.00 | 0.00 | 1.28 | 0.00 | 0.51 | |
| LoCLoD | LoCMeD | LoCHiD | MeCLoD | MeCMeD | MeCHiD | HiCLoD | HiCMeD | HiCHiD | |||||||||||
|---|---|---|---|---|---|---|---|---|---|---|---|---|---|---|---|---|---|---|---|
| Variable | est. | std. err. | est. | std. err. | est. | std. err. | est. | std. err. | est. | std. err. | est. | std. err. | est. | std. err. | est. | std. err. | est. | std. err. | |
| (1000 * TLU_horse) | Mean | 5 | 2 | 1 | 1 | 1 | 0 | 3 | 1 | 5 | 2 | 1 | 0 | 2 | 1 | 2 | 1 | 2 | 1 |
| Q50 | 0 | 0 | 0 | 0 | 0 | 0 | 0 | 0 | 0 | 0 | 0 | 0 | 0 | 0 | 0 | 0 | 0 | 0 | |
| (1000 * TLU_cattle) | Mean | 21 | 4 | 9 | 3 | 15 | 4 | 24 | 4 | 22 | 6 | 10 | 3 | 26 | 4 | 35 | 17 | 14 | 3 |
| Q50 | 0 | 0 | 0 | 0 | 0 | 0 | 0 | 0 | 0 | 0 | 0 | 0 | 0 | 0 | 0 | 0 | 0 | 0 | |
| (1000 * TLU_pigs) | Mean | 9 | 2 | 4 | 2 | 3 | 1 | 8 | 1 | 6 | 2 | 7 | 1 | 6 | 1 | 5 | 1 | 4 | 1 |
| Q50 | 0 | 0 | 0 | 0 | 0 | 0 | 0 | 0 | 0 | 0 | 0 | 0 | 0 | 0 | 0 | 0 | 0 | 0 | |
| (1000 * TLU_sheep) | Mean | 24 | 3 | 17 | 3 | 17 | 1 | 36 | 2 | 45 | 6 | 35 | 2 | 34 | 2 | 32 | 3 | 36 | 2 |
| Q50 | 0 | 0 | 0 | 0 | 0 | 0 | 0 | 3 | 12 | 9 | 0 | 0 | 0 | 0 | 0 | 0 | 0 | 0 | |
| (1000 * TLU_small) | Mean | 8 | 1 | 6 | 1 | 5 | 0 | 12 | 1 | 11 | 1 | 12 | 1 | 11 | 1 | 11 | 1 | 10 | 1 |
| Q50 | 0 | 1 | 3 | 1 | 0 | 0 | 7 | 1 | 8 | 2 | 8 | 1 | 4 | 1 | 7 | 2 | 3 | 1 | |
| (1000 * TLU_total) | Mean | 67 | 9 | 38 | 7 | 42 | 5 | 83 | 6 | 88 | 13 | 66 | 5 | 79 | 6 | 83 | 18 | 66 | 5 |
| Q50 | 4 | 3 | 4 | 4 | 0 | 0 | 27 | 3 | 32 | 8 | 27 | 4 | 19 | 3 | 19 | 4 | 22 | 4 | |
| LoCLoD | LoCMeD | LoCHiD | MeCLoD | MeCMeD | MeCHiD | HiCLoD | HiCMeD | HiCHiD | |||||||||||
|---|---|---|---|---|---|---|---|---|---|---|---|---|---|---|---|---|---|---|---|
| Variable | est. | std. err. | est. | std. err. | est. | std. err. | est. | std. err. | est. | std. err. | est. | std. err. | est. | std. err. | est. | std. err. | est. | std. err. | |
| (100 * seeds) | Mean | 9 | 1 | 10 | 3 | 13 | 1 | 18 | 2 | 20 | 4 | 21 | 3 | 16 | 2 | 16 | 3 | 20 | 2 |
| Q50 | 0 | 0 | 0 | 0 | 0 | 0 | 0 | 0 | 0 | 0 | 0 | 0 | 0 | 0 | 0 | 0 | 0 | 0 | |
| (100 * fert_any) | Mean | 35 | 3 | 17 | 4 | 26 | 2 | 46 | 2 | 42 | 5 | 34 | 4 | 45 | 2 | 42 | 5 | 38 | 2 |
| Q50 | 0 | 0 | 0 | 0 | 0 | 0 | 0 | 26 | 0 | 26 | 0 | 0 | 0 | 0 | 0 | 26 | 0 | 0 | |
| (100 * fert_inorg) | Mean | 29 | 3 | 13 | 3 | 18 | 2 | 36 | 3 | 36 | 5 | 27 | 3 | 35 | 2 | 28 | 4 | 25 | 2 |
| Q50 | 0 | 0 | 0 | 0 | 0 | 0 | 0 | 0 | 0 | 0 | 0 | 0 | 0 | 0 | 0 | 0 | 0 | 0 | |
| (100 * fert_org) | Mean | 8 | 2 | 5 | 2 | 11 | 2 | 12 | 1 | 8 | 2 | 8 | 1 | 12 | 1 | 15 | 4 | 15 | 2 |
| Q50 | 0 | 0 | 0 | 0 | 0 | 0 | 0 | 0 | 0 | 0 | 0 | 0 | 0 | 0 | 0 | 0 | 0 | 0 | |
| (100 * herb) | Mean | 31 | 3 | 41 | 5 | 41 | 2 | 63 | 3 | 57 | 5 | 64 | 3 | 65 | 2 | 71 | 4 | 57 | 3 |
| Q50 | 0 | 0 | 0 | 22 | 0 | 0 | 100 | 0 | 100 | 0 | 100 | 0 | 100 | 0 | 100 | 0 | 100 | 0 | |
| (100 * pest) | Mean | 15 | 2 | 12 | 3 | 20 | 2 | 26 | 2 | 24 | 5 | 28 | 3 | 38 | 2 | 40 | 5 | 35 | 3 |
| Q50 | 0 | 0 | 0 | 0 | 0 | 0 | 0 | 0 | 0 | 0 | 0 | 0 | 0 | 0 | 0 | 0 | 0 | 0 | |
| (100 * irr) | Mean | 0 | 0 | 0 | 0 | 1 | 0 | 0 | 0 | 2 | 1 | 1 | 0 | 1 | 0 | 0 | 0 | 1 | 0 |
| Q50 | 0 | 0 | 0 | 0 | 0 | 0 | 0 | 0 | 0 | 0 | 0 | 0 | 0 | 0 | 0 | 0 | 0 | 0 | |
| (100 * fuel) | Mean | 16 | 2 | 14 | 4 | 23 | 2 | 28 | 2 | 27 | 4 | 27 | 3 | 35 | 2 | 25 | 4 | 30 | 2 |
| Q50 | 0 | 0 | 0 | 0 | 0 | 0 | 0 | 0 | 0 | 0 | 0 | 0 | 0 | 0 | 0 | 0 | 0 | 0 | |
| (100 * hired_labor) | Mean | 30 | 3 | 38 | 6 | 42 | 2 | 44 | 2 | 40 | 5 | 48 | 4 | 49 | 2 | 59 | 4 | 49 | 3 |
| Q50 | 0 | 0 | 0 | 17 | 0 | 0 | 0 | 0 | 0 | 0 | 0 | 26 | 0 | 26 | 100 | 0 | 0 | 26 | |
Below are estimated distributions of key characteristics for farms below 4 ha (GLSS6, 2012/13).

Fig. 3.19: Est. Farm Sizes of Farm Holdings below 4 ha across Categories (2012/13, ha)

Fig. 3.20: Est. Cultivated Area of Farm Holdings below 4 ha across Categories (2012/13, ha)

Fig. 3.21: Est. Gross Farm Income of Farm Holdings below 4 ha across Categories (2012/13, ’000 Cedis)

Fig. 3.22: Est. Farm Holdings below 4 ha with Seed Purchases across Categories (2012/13, ’000 Cedis)

Fig. 3.23: Est. Farm Holdings below 4 ha using Organic Fertilizer across Categories (2012/13, ’000 Cedis)

Fig. 3.24: Est. Farm Holdings below 4 ha using Chemical Fertilizer across Categories (2012/13, ’000 Cedis)

Fig. 3.25: Est. Farm Holdings below 4 ha using Fuel and/or Maintenance Services across Categories (2012/13, ’000 Cedis)